Content Marketing
Americans' Paid News Subscriptions, February 2014 [CHART]
Just one-quarter of US consumers said that they currently paid for at least one news subscription.
Read MorePreferred News App Content, Smart Phone vs Tablet, December 2013 [CHART]
Getting breaking news via smartphone apps was far more popular than on tablets, likely due to the former being more portable.
Read MoreMost Important News Category For Mobile News App Users, December 2013 [CHART]
42% of US mobile news app users said that breaking news was the most important news app category.
Read MoreLong-Form Video Share Of Time Watched By Device, Q4 2013 [CHART]
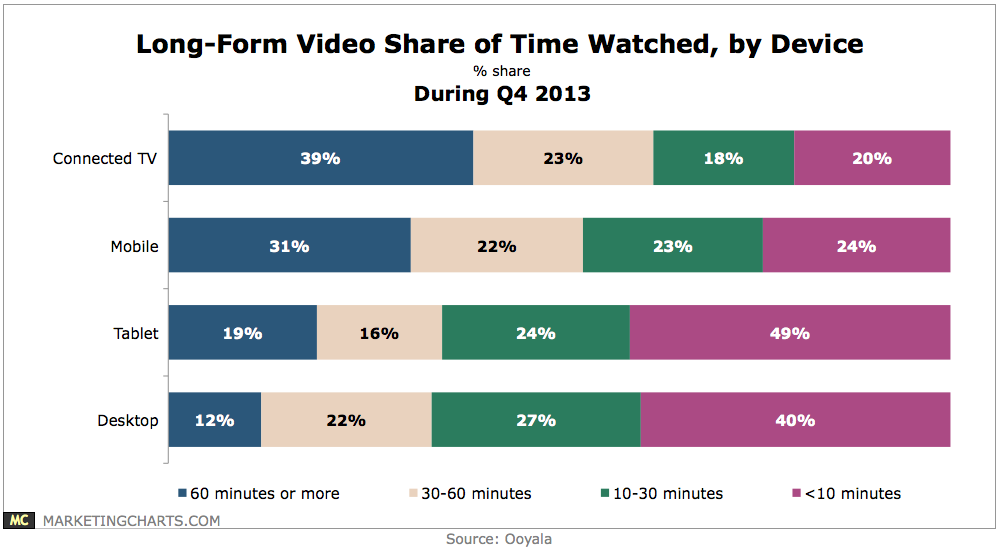
The majority of mobile video viewing time in Q4 2013 was spent with content at least a half-hour in length.
Read MoreMedia Gender Gap [INFOGRAPHIC]
Male journalists make up 63% of bylines in print, Internet and wire news media, according to a recent report from the Women’s Media Center.
Read MoreUS Mobile Banking Demographics, March 2014 [CHART]
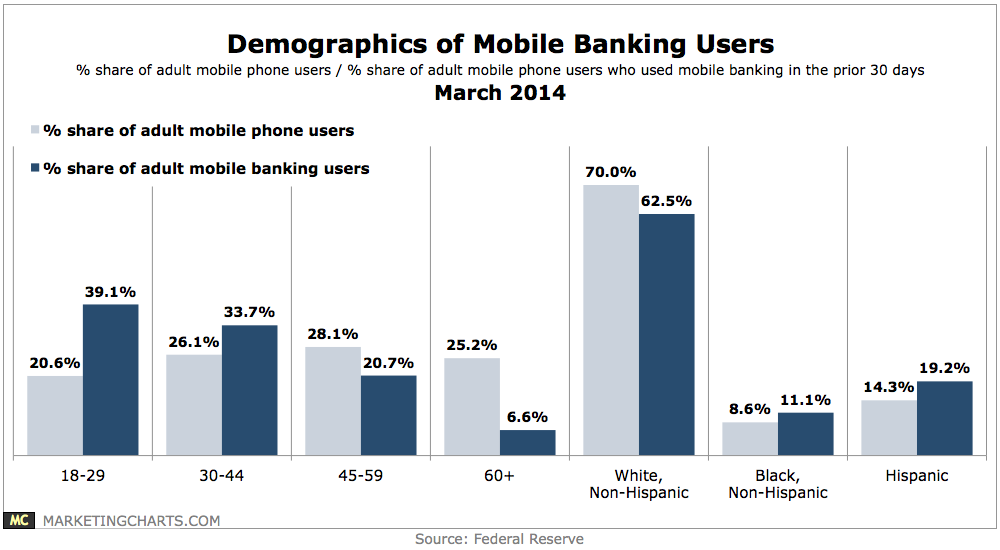
33% of mobile phone owners had used mobile banking during the 30 days prior to the survey, up from 28% a year earlier.
Read MoreUS News Media Revenue Sources In 2013 [CHART]
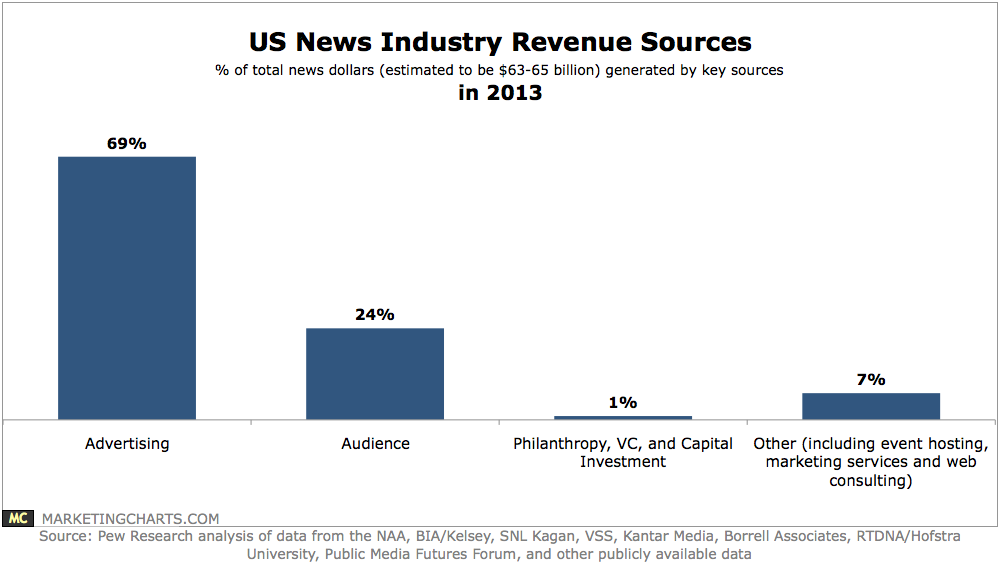
The US news industry generates somewhere between $63 and $65 billion in annual revenues compared to Google’s $58 billion revenues.
Read MoreUK Entertainment Sales Share, 2013 [CHART]
Access Services grew their share of entertainment sales by 35.6% to reach 26% of the entertainment retail market.
Read MoreUK Entertainment Sales By Category & Channel, 2013 [TABLE]
Internet-derived sales rose 13.9% year over year in 2013 to account for 60.0% of the UK entertainment retail market.
Read MoreTypes Of Brand Communications College Students Want On Snapchat, February 2014 [CHART]
The opportunity to receive discounts or promotions was the top reason college students would want to receive Snapchat communications from brands, cited by 67%.
Read More