Content Marketing
Monthly TV Everywhere Videos Viewed By Device, Q1 2013 & Q1 2014 [CHART]
The number of unique TV Everywhere visitors in the US rose 157% between Q1 2013 and Q1 2014 and 49% between Q4 2013 and Q1 2014.
Read MoreTide Culturejacks Game Of Thrones & Google+ Thumbnails Are Going Away [VIDEO]

Episode 54 of the Beyond Social Media show: David Erickson & BL Ochman discuss Tide’s culturejacking of Game of Thrones and Google+’s vanishing thumbnails.
Read MoreGlobal Time Spent Watching eSports Video [CHART]
IHS projected impressive growth through 2018, when total eSports viewing hours were forecast to reach 6.6 billion worldwide.
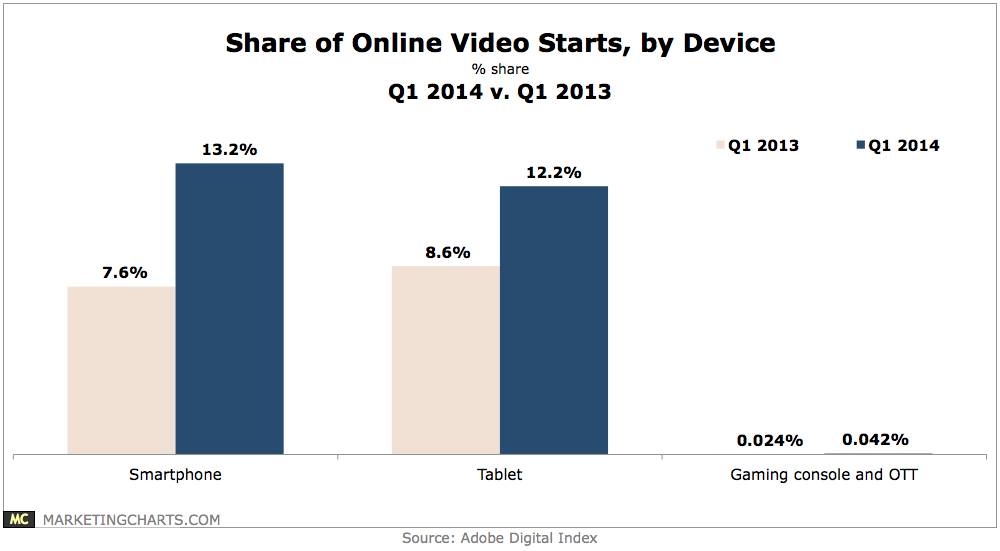
Read MoreVideo Viewing On Connected Devices, 2013 vs 2014 [CHART]
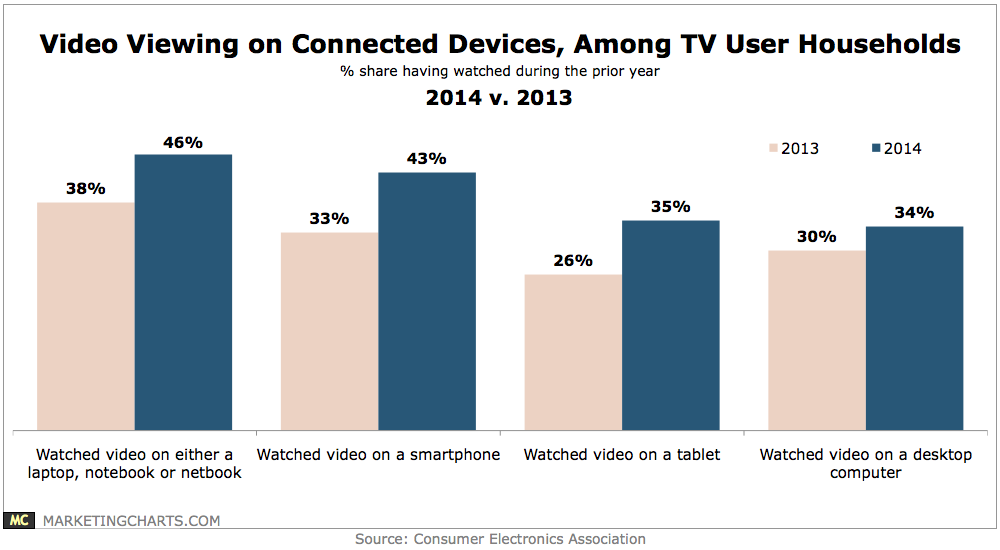
Almost half (46%) of TV user households watched video on a portable computer during the past year, with 43% watching video on a smartphone and 35% on a tablet.
Read MoreNetflix Branded Content Examples & Wikipedia's Battle Against Brands [VIDEO]
Episode 53 of the Beyond Social Media show: David Erickson & BL Ochman discuss examples of Netflix branded content efforts & Wikipedia’s battle with brands.
Read MoreGlobal Executives' Top Sources Of Industry News, June 2014 [CHART]

A majority of global executives rely on email newsletters for industry-specific news.
Read MoreAmazon Prime Spending vs Non-Prime Customers [CHART]
People who subscribe to Amazon Prime spend a lot more than non-Prime members.
Read MoreSocial Channels Top Charities & Non-Profits Use, June 2014 [CHART]
Social media use is almost ubiquitous among top charities and non-profits, with 98% using at least one platform.
Read MoreSocial Networks Play The Game Of Thrones [INFOGRAPHIC]
This infographic from Marketo imagines the social networks playing Game of Thrones.
Read MoreMobile Users Most Important Devices For Information, June 2014 [CHART]
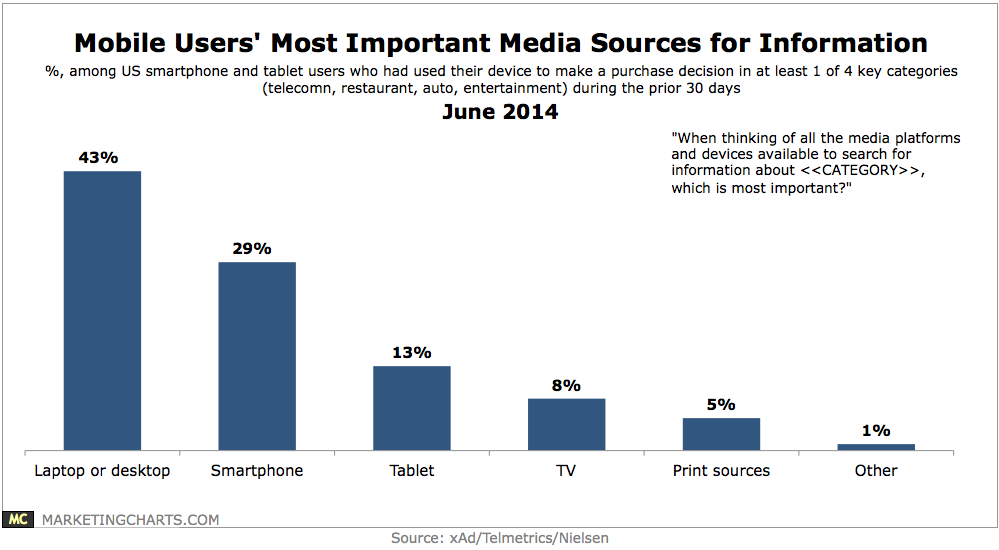
Some 29% named their smartphone the most important media platform when searching for information during the purchase process, up from 23% the prior year.
Read More