Content Marketing
Twitter Video & Social Video Metrics
Twitter’s much-anticipated native video upload capability is rolling out to everyone. While video is the new big thing, video metrics continue to underwhelm.
Read MoreMobile Downloads & In-App Revenues, 2013-2016 [TABLE]
Ebook sales will reach $4.25 billion in 2015, accounting for 43.3% of US mobile download and in-app revenues in 2015.
Read MoreMobile Game Revenues By Venue, 2013-2016 [TABLE]
Mobile content revenues in the US will total $9.82 billion in 2015, a 10.3% increase from 2014.
Read MoreTelevision & Streaming Video Penetration, 2012-2014 [TABLE]
34% of US households have streamed digital TV and video.
Read MoreAmazon As A Streaming Videos Service, May 2013-September 2014 [CHART]
Over 50 million people consider themselves Amazon Prime members.
Read MorePrimary Content Sharing Channel By Device, Q4 2014 [CHART]
Facebook accounted for 85% of mobile sharing activity among US internet users in Q4 2014, according to ShareThis, up 51% year over year.
Read MoreGrowth In Content Sharing Channels, Q4 2014 [CHART]
Despite rumors popping up every so often that some people may be cutting back on Facebook usage, the social network reigns supreme.
Read MoreMobile Millennials Expectations For Brands Technology Use, February 2015 [CHART]

Mobile Millennials are more likely to expect brands to have a mobile-friendly website or app than they are to expect brands to have a social media presence.
Read MoreTop Ways People Would Use Wearables, December 2014 [CHART]
Among the 67.7% of US smartphone owners who didn’t own a wearable, smart wristbands such as Fitbit and Jawbone were of the most interest, cited by 39.4%.
Read MoreMost Socially-Shared Content By Type [INFOGRAPHIC]
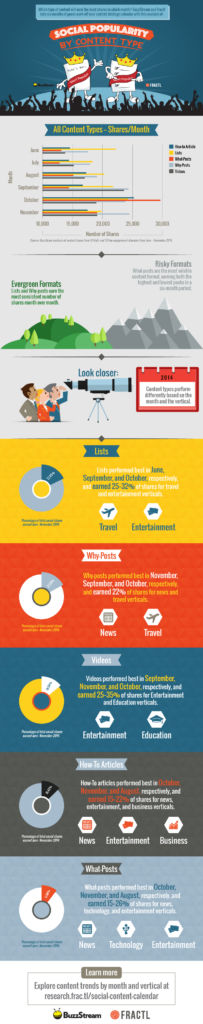
This infographic by looks at the most popular types of content shared on social media based on sharing data from 220,000 articles from 11 vertical industries.
Read More