Content Marketing
Americans' Daily Media Consumption, 2012 vs 2013 [CHART]
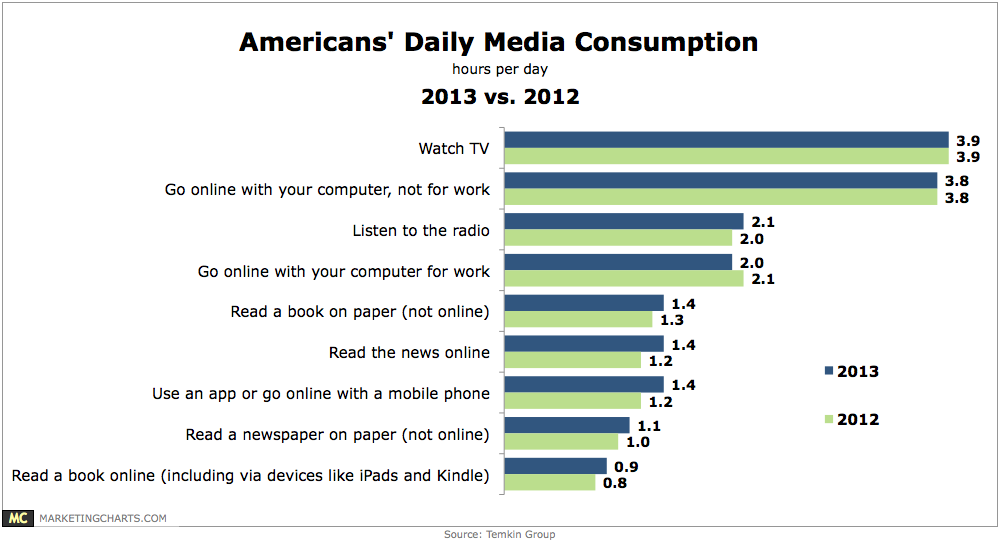
Americans are holding steady in terms of their TV consumption and non-work-related internet use, but are spending more time with other activities such as reading books and accessing the internet via a mobile device.
Read MoreHow Brands Foster Consumer Connectedness, April 2013 [CHART]
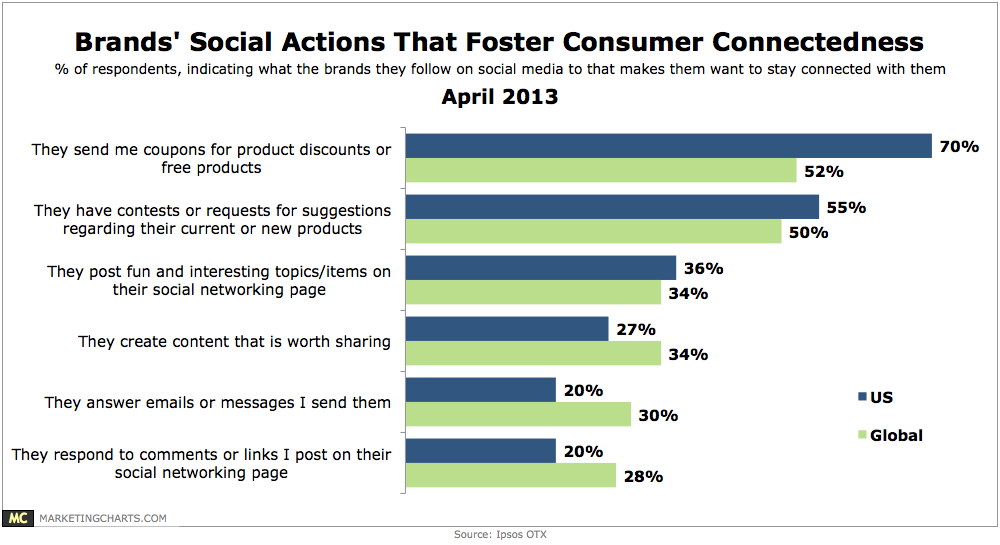
Asked what the brands they follow on social media do to make them want to stay connected to them, 70% said brands send them coupons for product discounts or free products.
Read MoreMobile Device Use By Activity & Device Size, February 2013 [CHART]
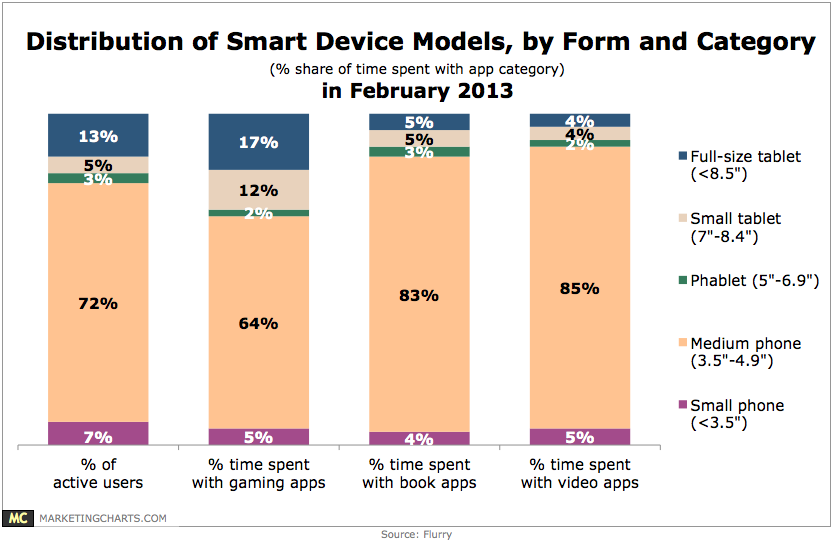
While small (5%) and full-size (13%) tablets accounted for less than 20% of active smart device users around the world, they represented 29% of time spent playing gaming applications on such devices in February 2013.
Read MoreBeyond Social Media: Macy's $1,453 Typo; Yelp Reviews; Prankvertising; Kevin Ware & Social Empathy [PODCAST]

This week: Macy’s $1,453 Typo; Yelp’s Filtered Reviews; Nike’s Winning Ad Lampooned; Prankvertising; Kevin Ware & Social Empathy; Silent Instagram Film Trailers; Punch Pizza Goes To Naples; HP’s Bouncing Cam; Blogging Rules; Shiny New Stuff & Daily Numbers.
Read MoreContent Sharing Trends, April 2013 [TABLE]
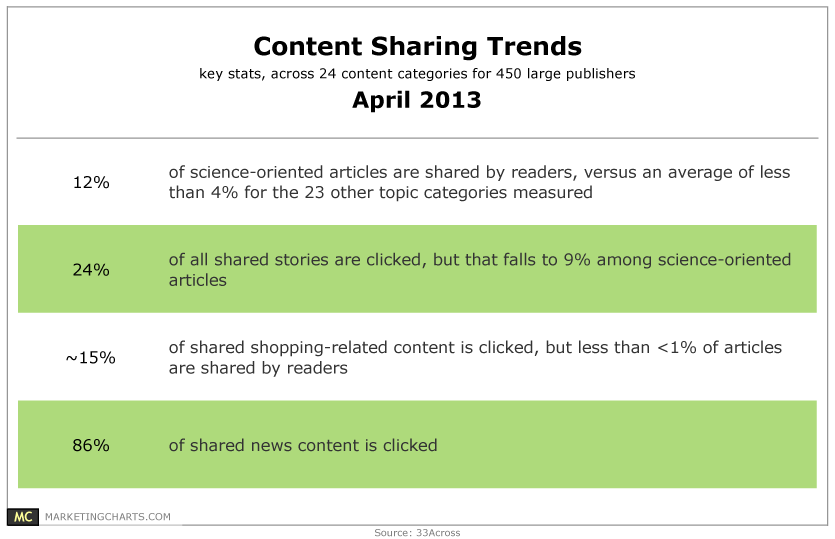
The types of content that people share may be driven more by ego than anything else.
Read MorePrimary Uses Of Hashtags, April 2013 [CHART]
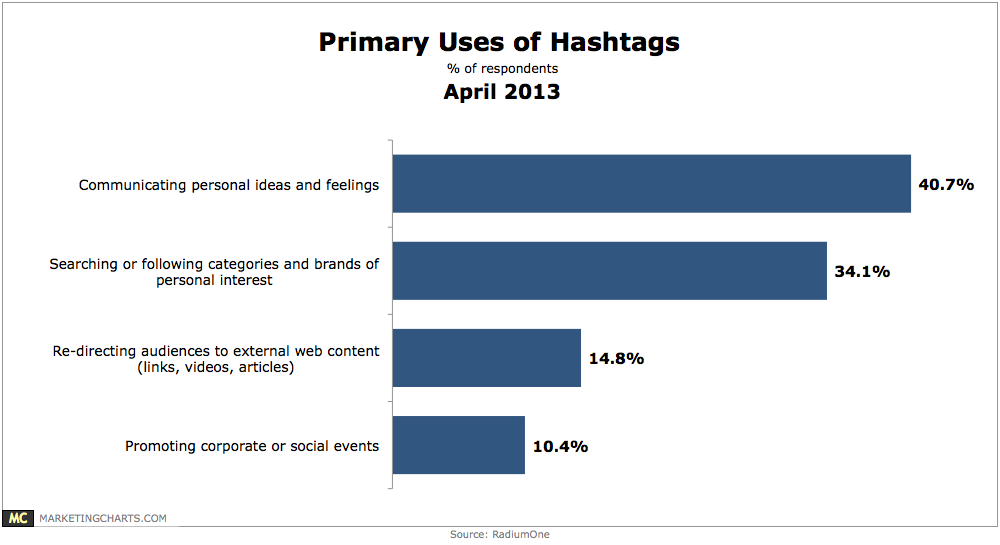
Hashtags are used primarily to communicate personal ideas and feelings (40.7%) and to search or follow categories and brands of personal interest (34.1%).
Read MoreWhere People Consume Text & Video Content, March 2013 [CHART]
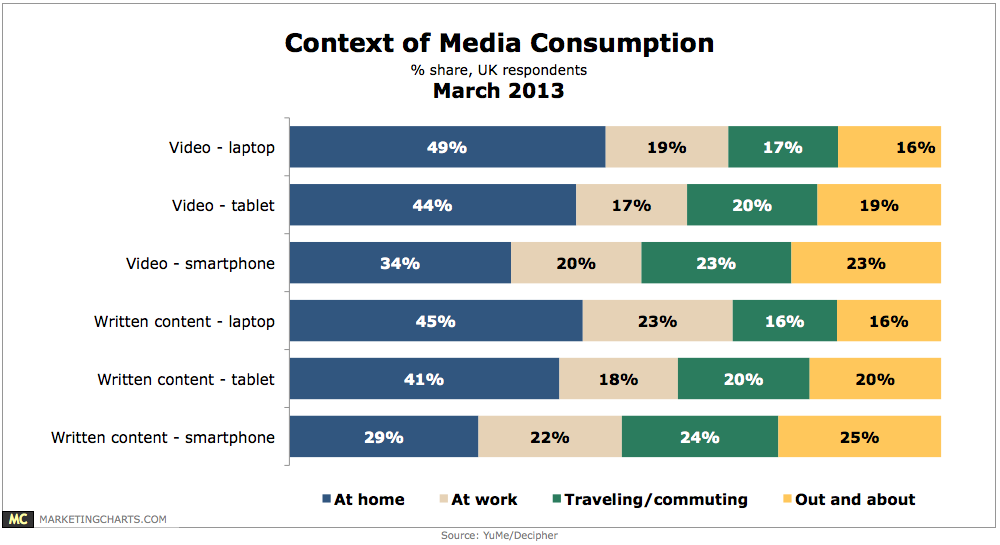
Regardless of device, consumption of videos takes place most often in the home and users are both more relaxed and explorative while at home.
Read MoreGoogle Universal Search Results By Content Type, 2012 [CHART]

A new study show the visibility of Google Shopping in Google’s Universal Search results dropped significantly after the search engine implemented a new paid inclusion model.
Read MoreGoogle's Universal Search [INFOGRAPHIC]
This infographic from Search Metrics illustrates their study of Google’s Universal Search results.
Read MoreNews Consumption Time By Device, March 2013 [CHART]
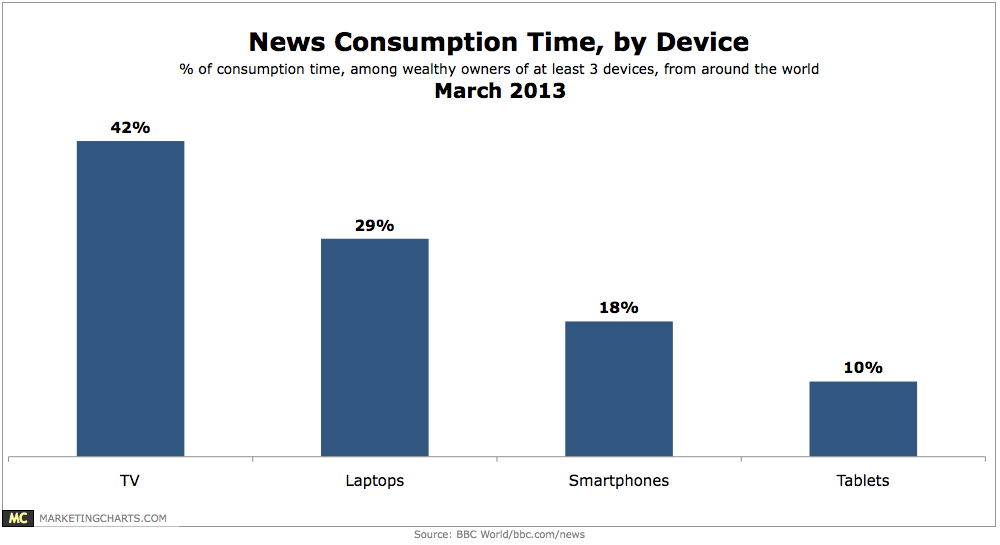
TV is still the primary device for news consumption, at 42% of respondents’ time, compared to 29% for laptops, 18% for smartphones, and 10% for tablets.
Read More