Content Marketing
Most Difficult Lead Generation Tactics To Execute, April 2013 [TABLE]

Where B2Bs struggled was in utilizing social media marketing for lead gen purposes. Nearly half said this was one of the most difficult strategies to execute.
Read MoreMost Effective Lead Generation Tactics, April 2013 [TABLE]

When it comes to measuring leads, the greatest percentage (42%) of B2Bs used multichannel attribution, giving weight to various marketing channels that helped generate a conversion.
Read MoreNetwork TV Streaming & Pay TV, 2011 vs 2012 [CHART]
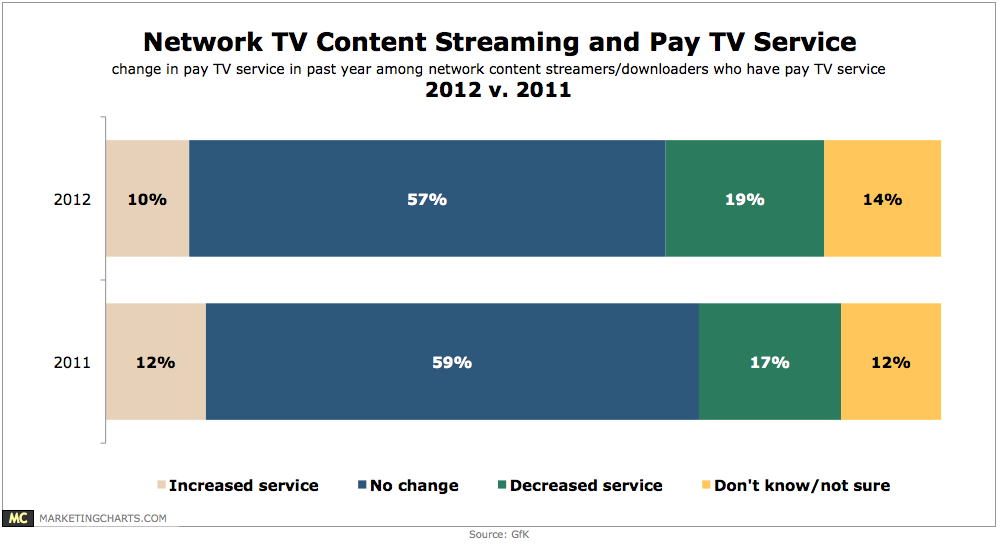
19% of TV video streamers and downloaders in 2012 reported decreasing service (“cord-slicing”) in the past year.
Read MoreEffect Of Streaming Video On Traditional TV Consumption, 2006-2012 [CHART]
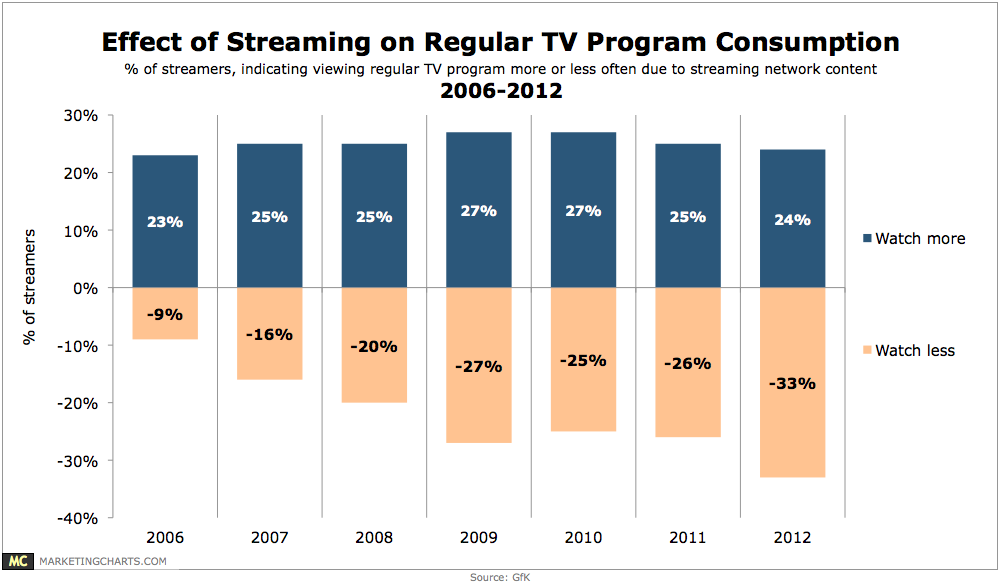
34% of US internet users (and 30% of all consumers aged 13-54) surveyed in December 2012 reported having watched streaming video content that originated from a network since the beginning of September.
Read MoreMobile Acts Prompted By Top Magazines By Month, 2011-2012 [CHART]
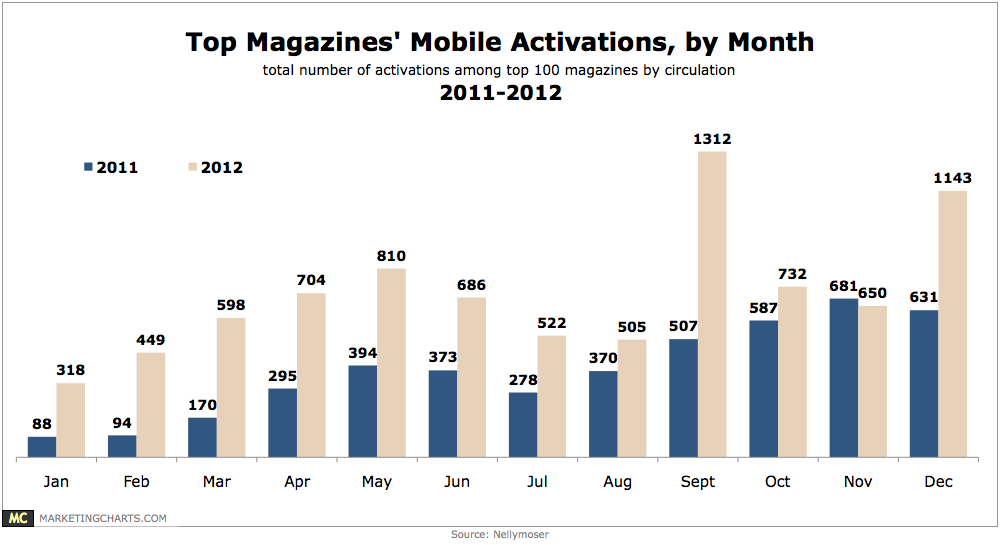
The number of mobile activations in the US’ top 100 magazines by circulation has grown from just 352 in Q1 2011 to 2,252 in Q4 2012.
Read MoreOnline Media Consumption Of CEOs, April 2013 [CHART]
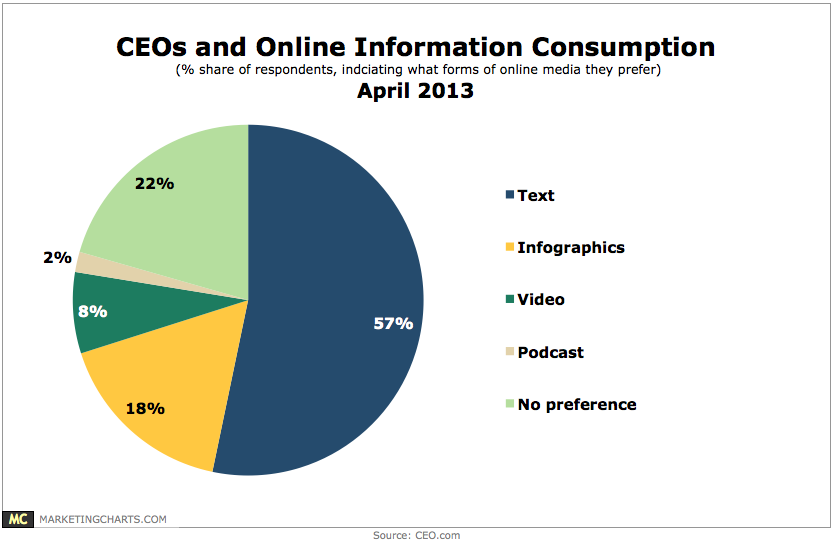
3 in 4 CEOs aged under 50 say they “mostly consume information online,” and close to 2 in 3 aged over 50 agree.
Read MoreSecond Screen TV-Related Behavior, April 2013 [CHART]
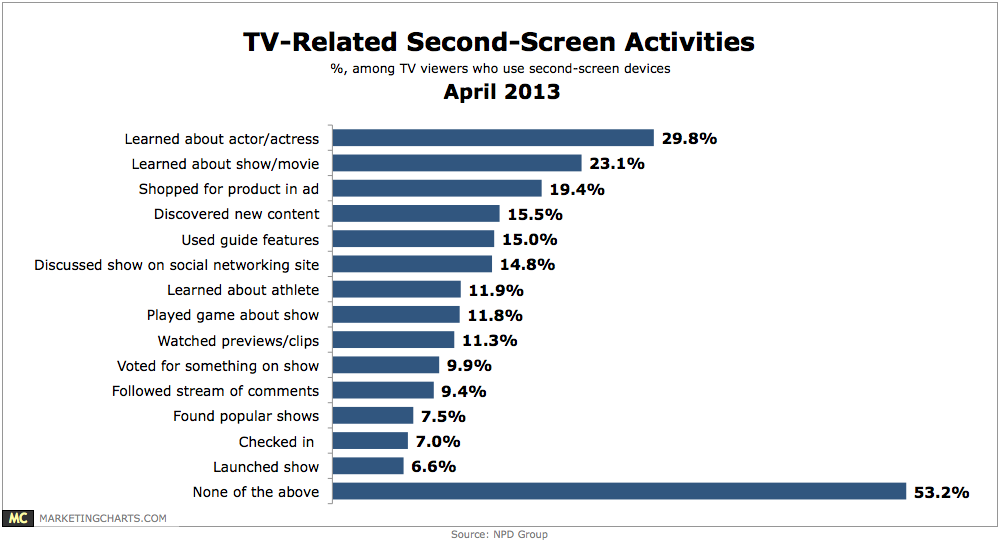
Among the most common is shopping for a product seen in an ad, by 19.4% of TV watchers who engage in second-screen activities.
Read MoreBroadcast TV Content Completion Rates Online By Device, 2012 [CHART]
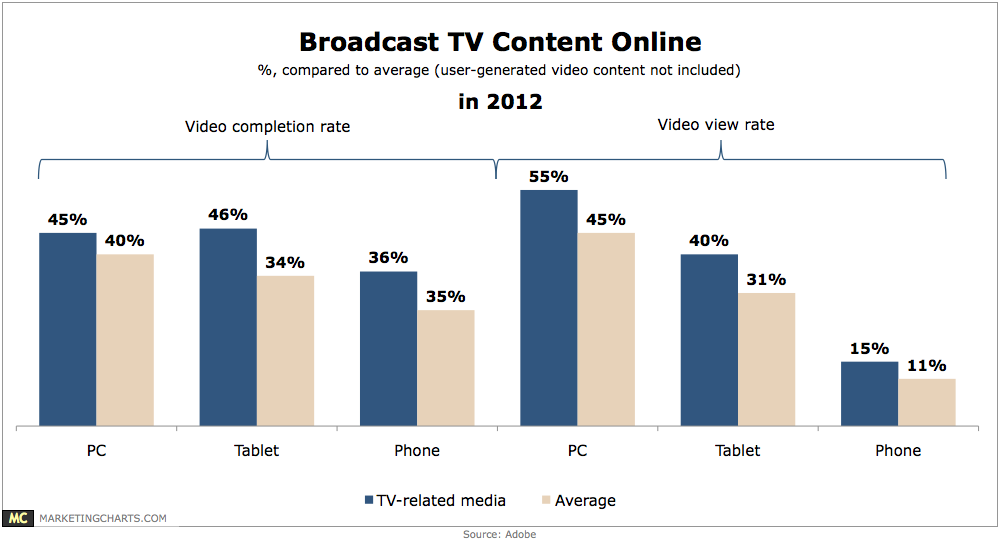
Compared to the average, completion rates for TV-related content (such as full episodes of TV shows) are 12.5% higher on PCs (45% vs. 40%), 31.4% higher on tablets (46% vs. 35%), and 33.3% higher on mobile phones (36% vs. 27%).
Read MoreNewspaper Revenue Trends, 2011 vs 2012 [TABLE]
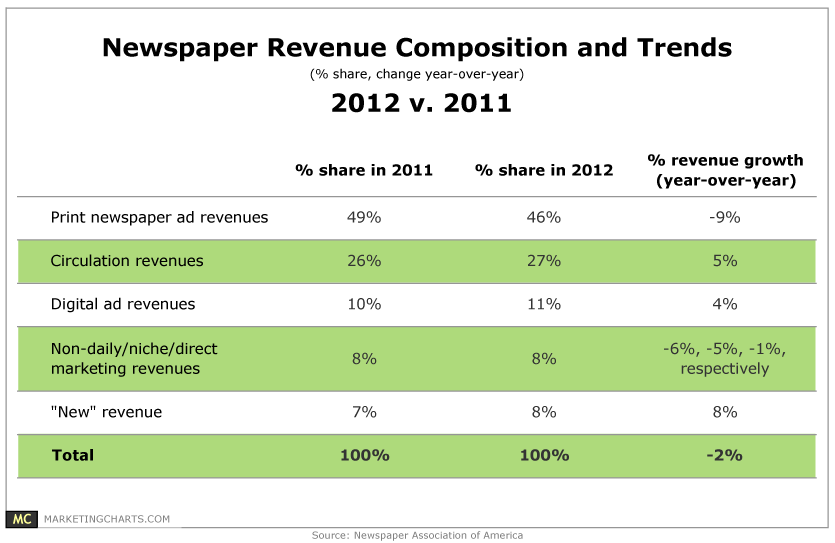
Newspaper ad revenues dropped by 6% last year, marking the 7th consecutive year of declines after a 7.3% fall last year.
Read MoreTime Spent Consuming Media By Select Channels, April 2013 [CHART]
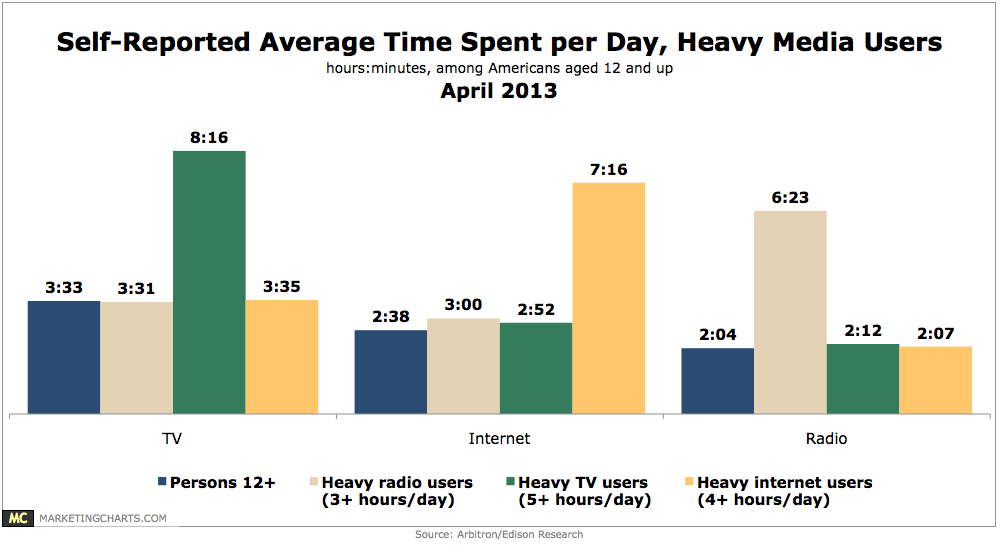
Heavy usage of one of the top 3 media (by reach) does not necessarily mean that less time is spent with the other media.
Read More