Content Marketing
Preferred Television Genres By Viewing Device, June 2013 [CHART]
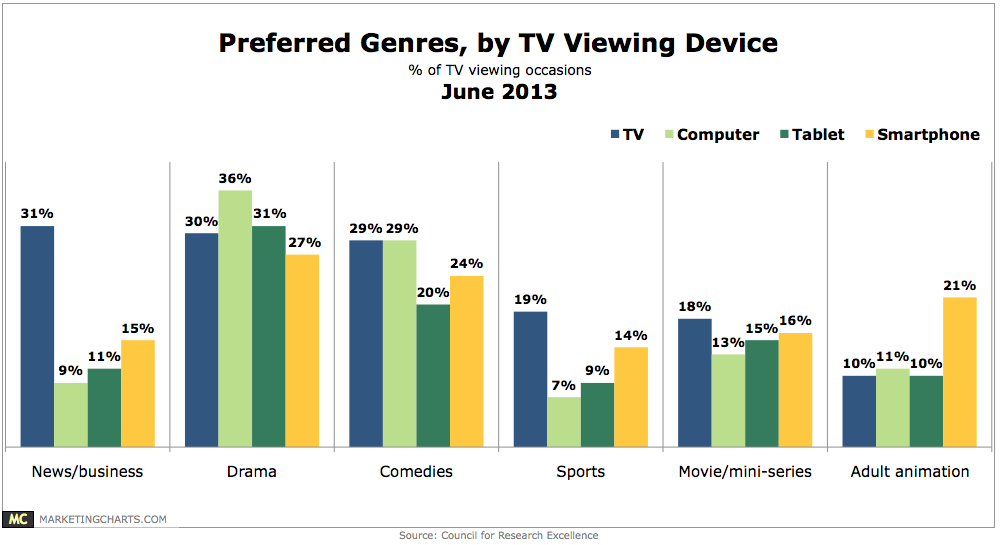
On the traditional TV, news and business (31%) got the edge on drama (30%) and comedies (29%) as the top genres by percentage of viewing occasions.
Read MoreTV Viewing Times By Device, June 2013 [TABLE]
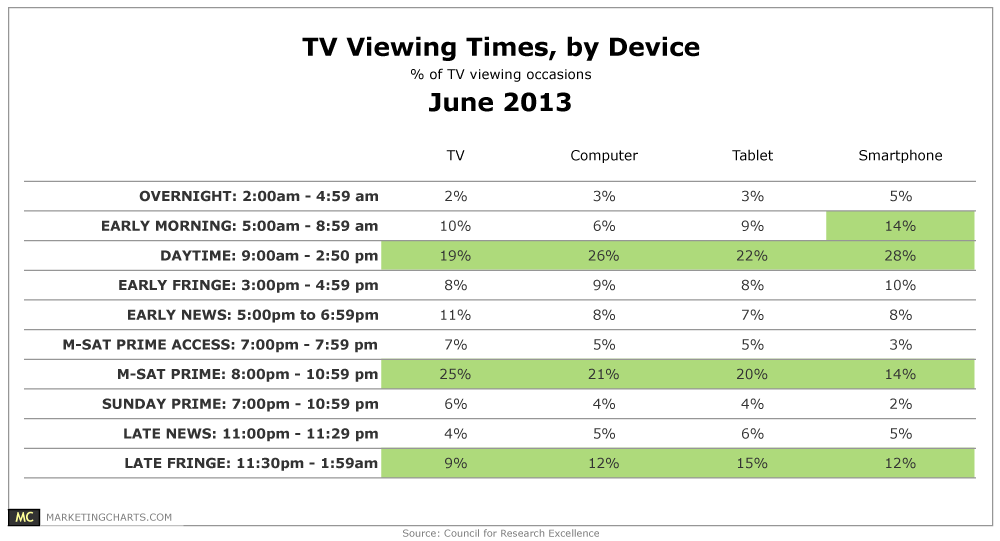
A plurality of tablet (22%) and smart phone (28%) TV viewing occasions tracked occurred during the daytime, between 9 AM and 3 PM.
Read MoreGlobal Entertainment & Media Content Spending, 2008, 2013 & 2017 [CHART]
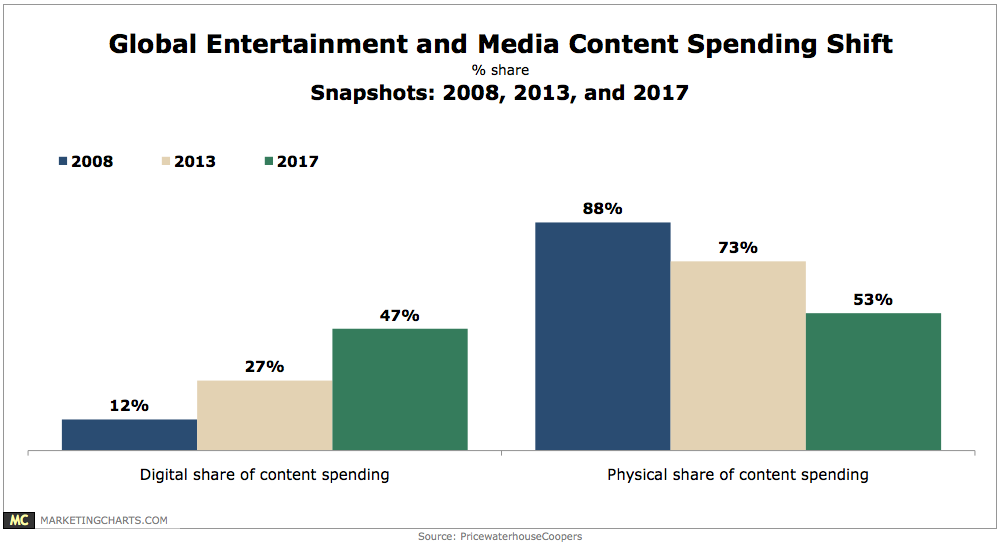
While physical purchases represented 88% of total spending on Entertainment & Media content in 2008, that number has dropped to 73% this year, and will fall to 53% by 2017.
Read MoreNewspaper Circulation & Advertising Trends By Region, 2012 [CHART]
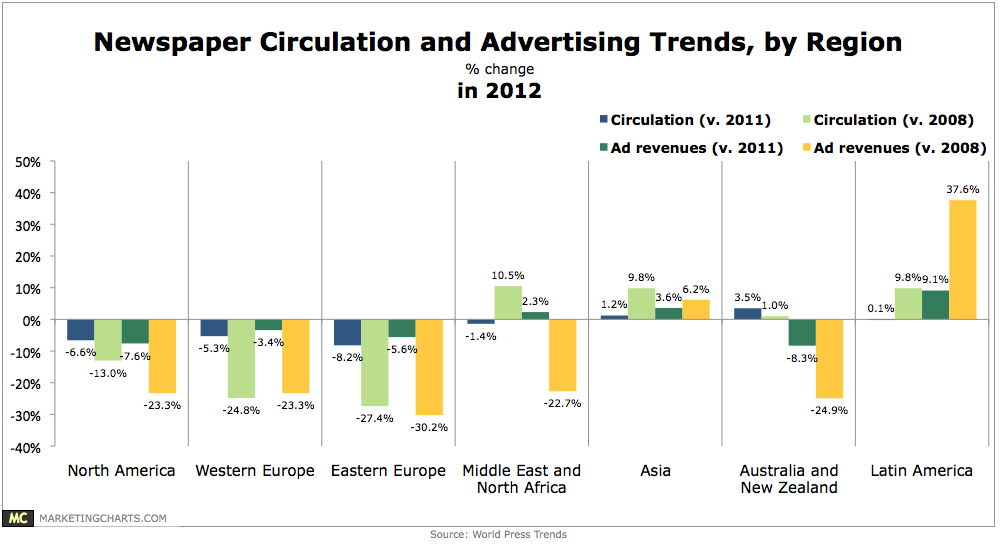
Newspaper circulation around the world dropped by only 0.9% in 2012, as losses in North America and other regions were almost completely offset by gains in Asia.
Read MoreTelevision Consumption By Device, June 2013 [CHART]
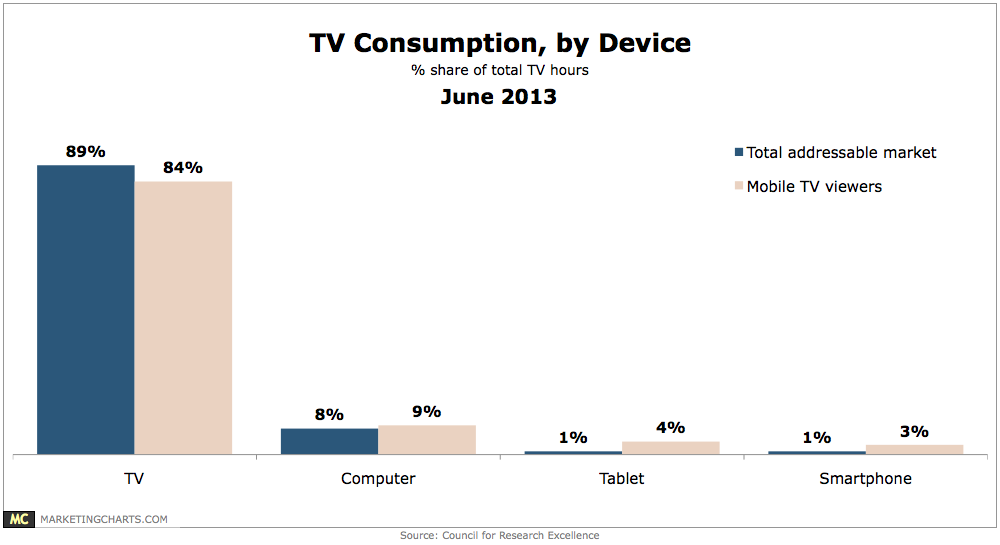
Just 2% of all TV hours logged were on tablets (1%) or smart phones (1%).
Read MoreSocial Media Sites Marketing Execs Use For Cross-Posting On Twitter, Q1 2013 [CHART]
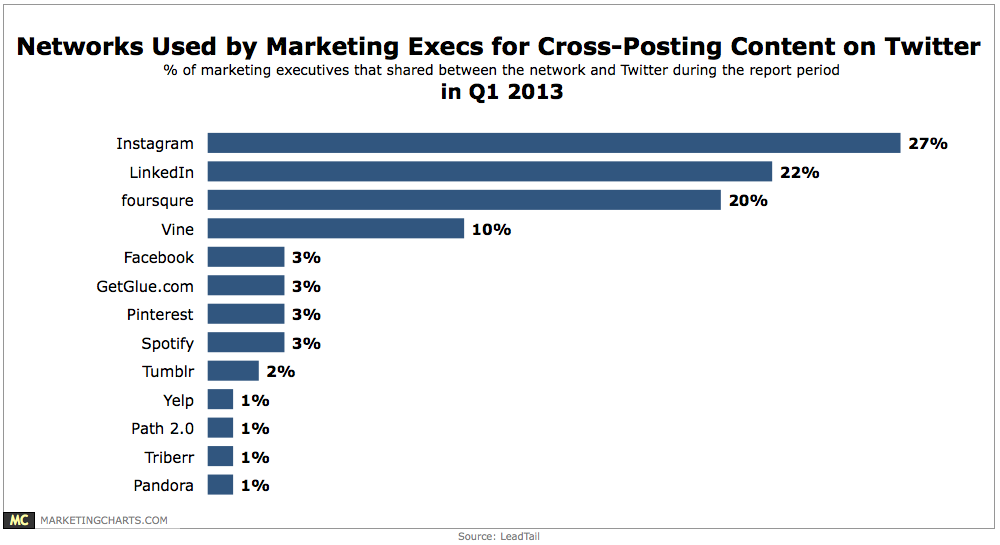
27% of marketing execs shared content between Instagram and Twitter, 22% shared content with LinkedIn, 20% with foursquare, and 10% with Vine.
Read MoreB2B Buyers' Attitudes Toward Online Content, June 2013 [TABLE]
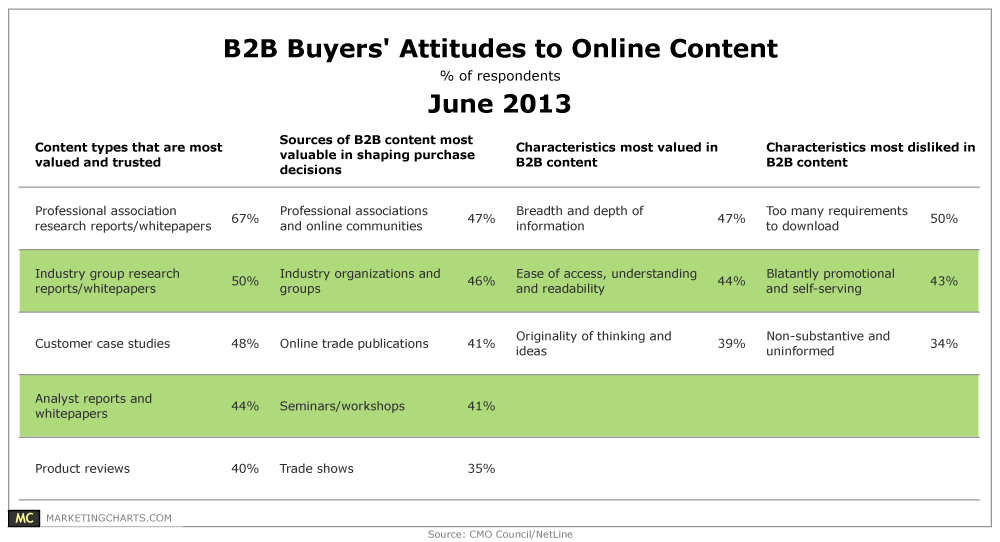
87% of B2B content consumers say that online content has a major (27%) or moderate (60%) impact on their vendor selection.
Read MoreOnline Video Views By Duration, Q1 2013 [CHART]
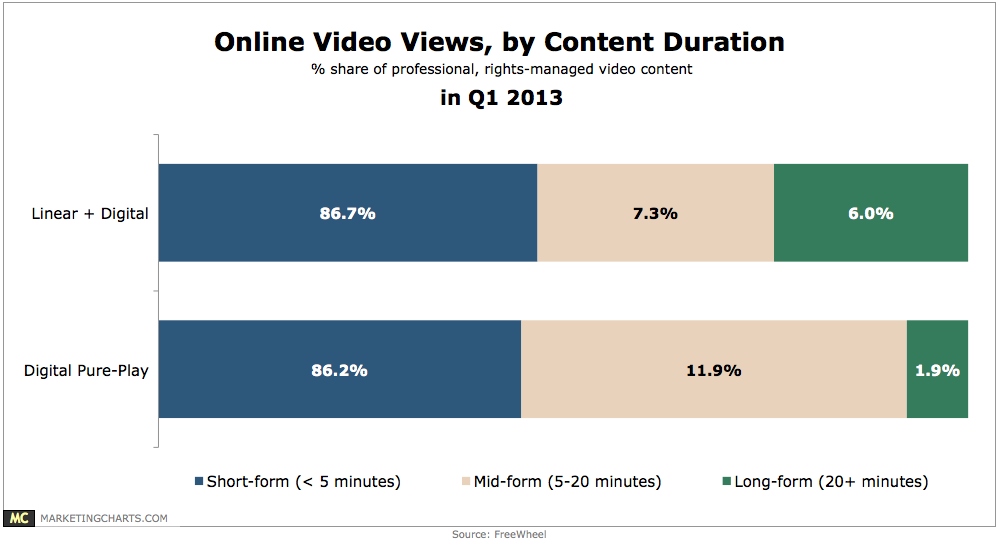
86.7% of video views on “Linear + Digital” networks were less than 5 minutes in length, as were 86.2% of video views on “Digital Pure-Play” networks.
Read MoreMoms' Social Sharing By Content Type, May 2013 [CHART]
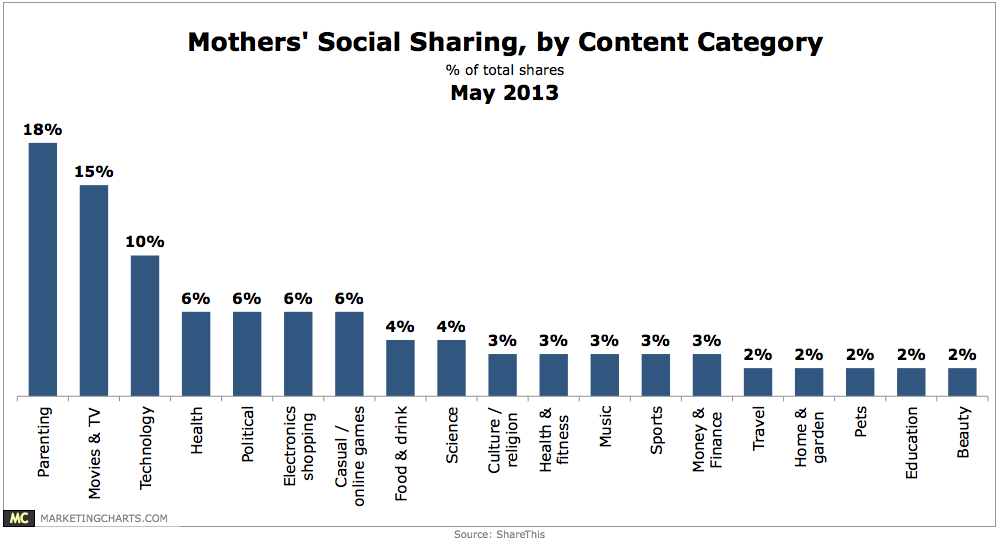
30% of mothers shared content on the ShareThis network during the period, compared to 10% of the network’s overall average.
Read MoreMobile Video Discovery Methods, May 2013 [CHART]
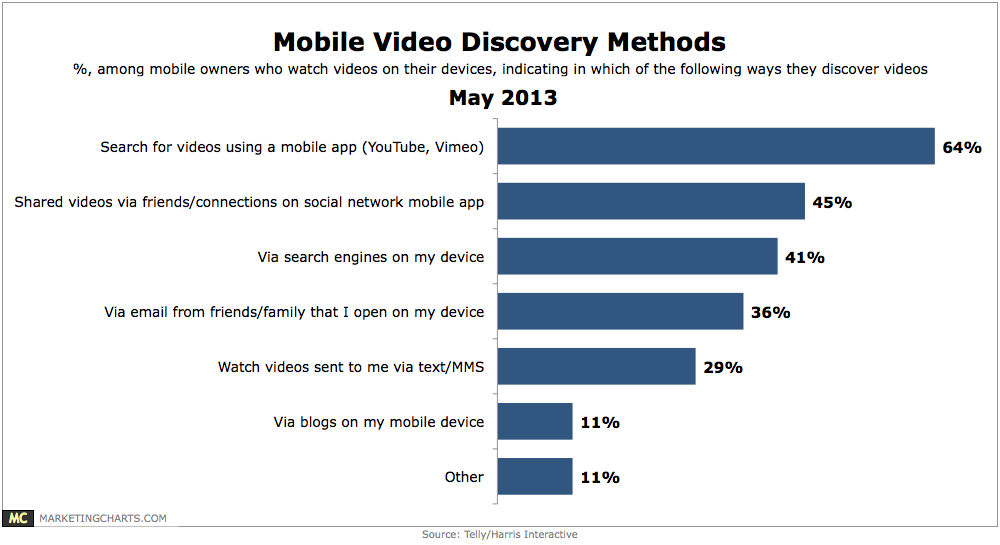
35% of mobile device owners watch videos on their device.
Read More