Content Marketing
Global Online Entertainment Activities By Device, Q1 2013 [TABLE]
Watching a video clip was the most popular activity, followed by checking for information on music, leisure or entertainment, and then playing an online game.
Read MoreFactors That Influenced TV & VOD Consumption On Alternate Devices, June 2013 [CHART]
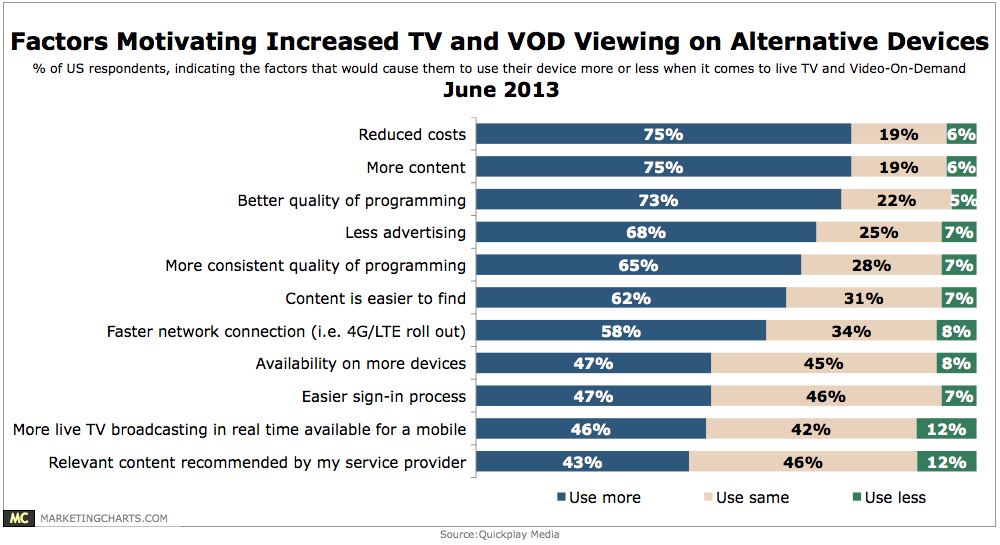
Roughly three-quarters of respondents in the US would be motivated to use their devices more for live TV and VOD viewing on account of reduced cost, more content, and better quality of programming.
Read MoreWhy Marketing Execs Don't Use Video In Email Marketing, February 2013 [CHART]
Forty-three percent of marketers said they didn’t use videos in email messaging simply because they lacked the content, making it the most prominent obstacle to the practice.
Read MoreTraditional Television Viewing By Age, Q1 2011-Q1 2013 [TABLE]
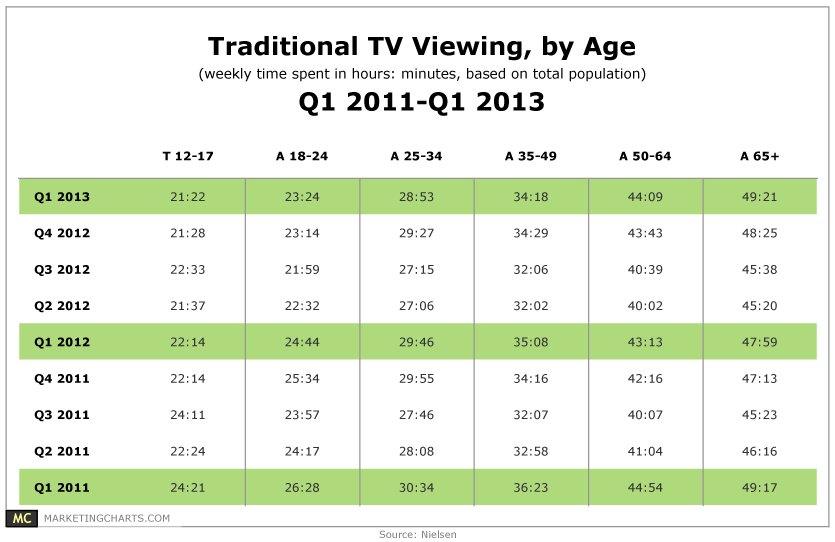
Traditional TV consumption continues to drop off on a year-over-year basis among 18-24-year-olds, though the rate of decline slowed somewhat in Q1.
Read MoreThe History Of Public Relations [INFOGRAPHIC]

This infographic about the history of public relations was created by GroupHigh.
Read MoreAmerican Sports Content Consumption [INFOGRAPHIC]
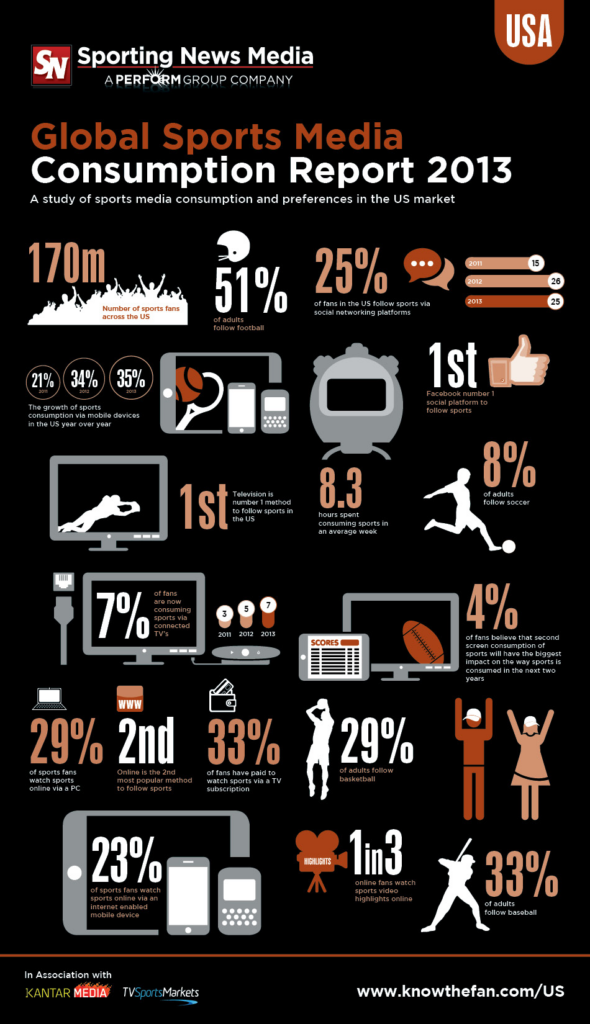
25% of sports fans use social media to follow leagues, teams and players online.
Read MoreWhere Americans Watch TV By Device, January 2013 [TABLE]
While smart mobile device users can now watch TV from anywhere, they still favor sitting at home to watch their shows.
Read MoreTime Americans Spend Watching Mobile TV By Device, January 2013 [CHART]
Only 2% of total TV viewership by American broadband subscribers who watched at least five hours of TV per week occurred on a tablet or smart phone.
Read MoreSubscription On-Demand Video Market Share, Q1 2012 vs Q1 2013 [CHART]
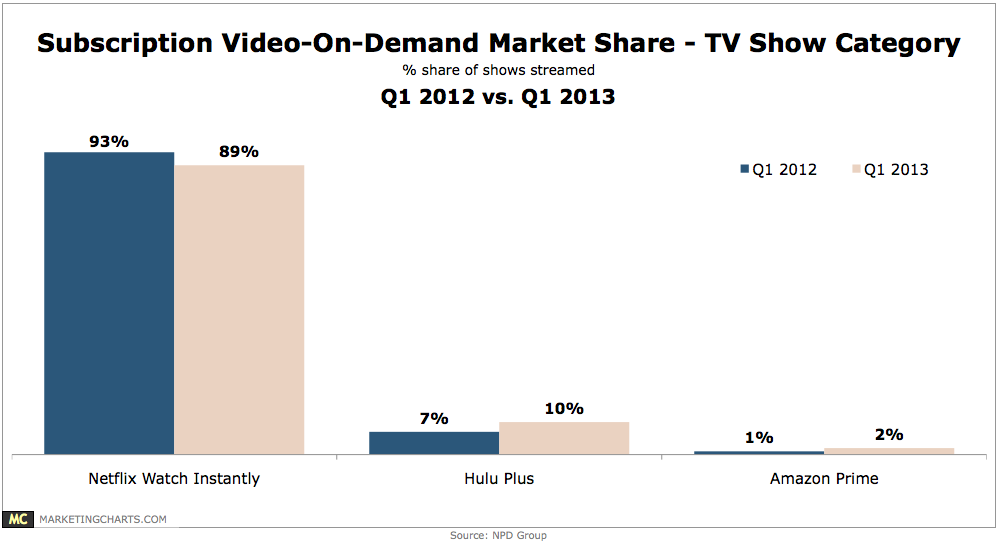
Netflix accounts for almost one-third of North American peak downstream internet traffic.
Read MoreTelevision Viewing Places By Device, June 2013 [TABLE]
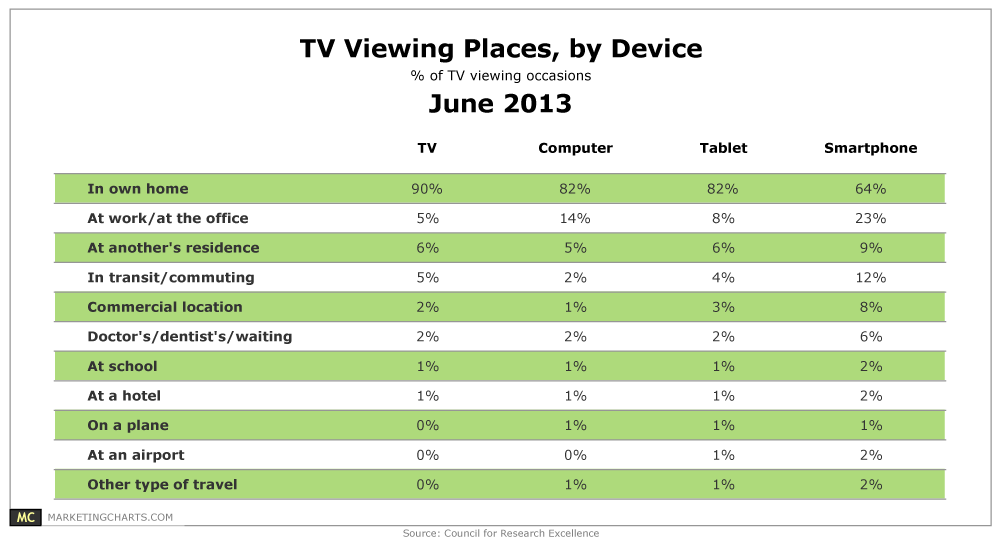
64% of smart phone TV viewing occasions occurred at home.
Read More