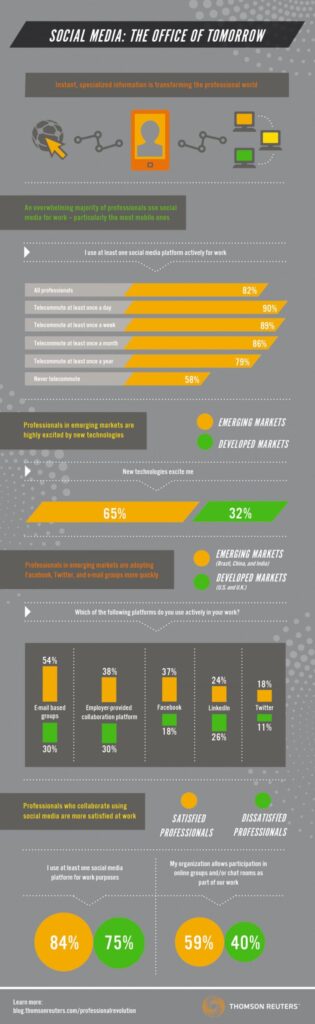
Content Marketing
Types Of Video People Watch On Their Smart Phones, Q3 2013 [CHART]
Just over 42% of internet users in North America watched news video content on their smart phones.
Read MoreApple App Store vs Google Play Store Revenues [CHART]
While Apple’s store is still tops around the world in terms of revenues, Google Play did gain share during 2013.
Read MoreThe Most Popular Books Of All Time [INFOGRAPHIC]
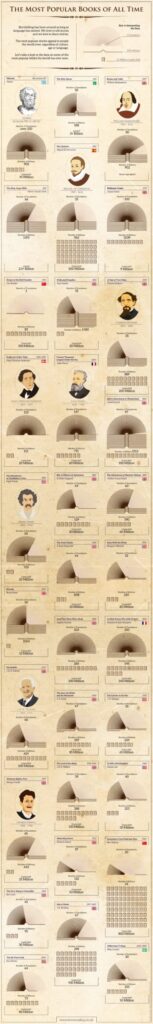
This infographic by lovereading.co.uk illustrates the most popular books of all time as measured by the number of editions, copies sold, and translations.
Read MoreDemographics Of Pot Smokers [INFOGRAPHIC]
This infographic by DietsInReview illustrates the results of a study in the American Journal Of Medicine of pot smokers thinness.
Read MoreBooks Vs. Movies [INFOGRAPHIC]
This infographic from LoveReading.co.uk illustrates which is more popular according to online reviews, the book or the movie upon which it is based.
Read MoreBranded Mobile Video Content Completion Rates, Q1 – Q3 2013 [CHART]
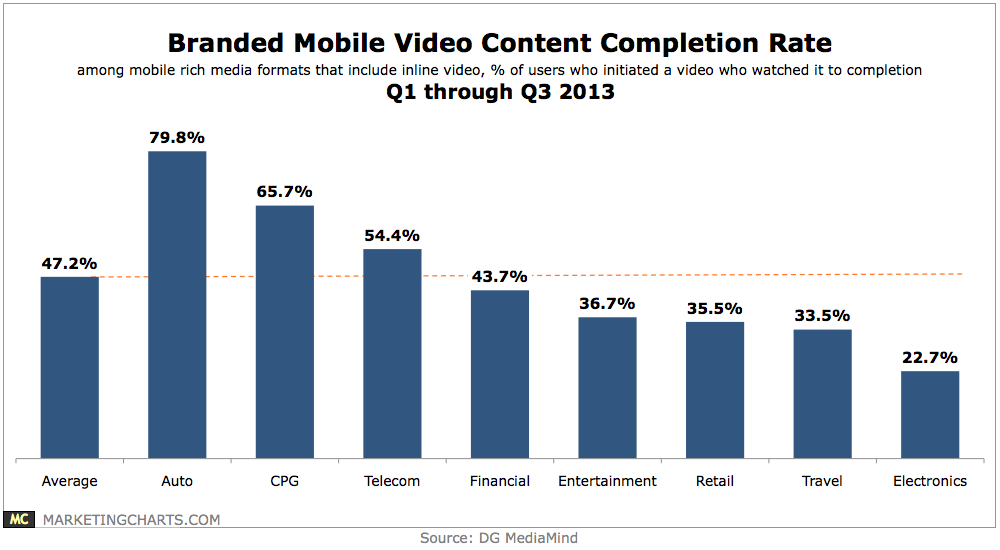
47.2% of branded videos initiated by users were watched to completion, with that figure highest for auto (79.8%), CPG (65.7%) and telecom (54.4%) advertisers.
Read MoreTop TV Programs Of 2013 [TABLE]

As in 2011 and 2012, this year’s top TV programs were almost exclusively the realm of NFL telecasts.
Read MoreUS Social Ad Revenue Forecast, Display vs Native 2012-2017 [CHART]
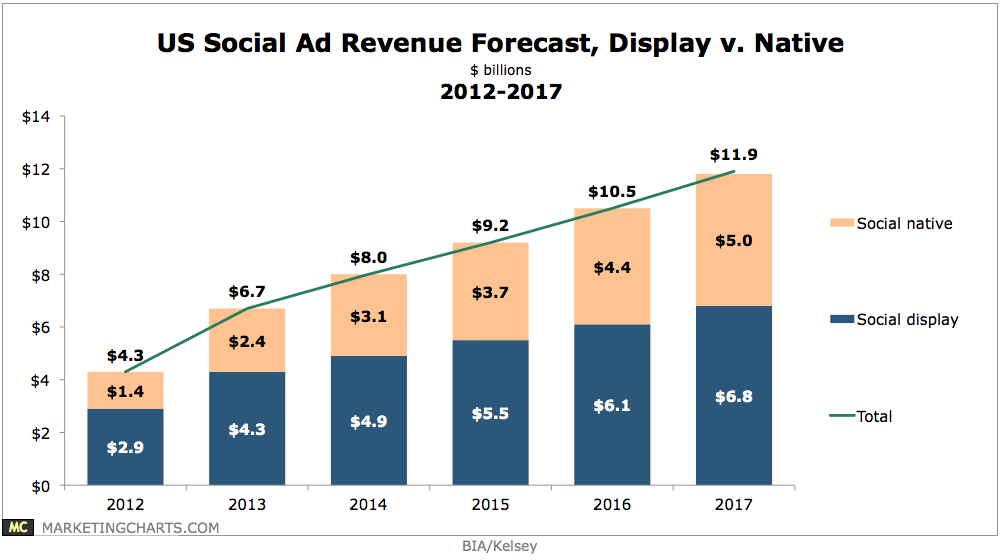
Native social ad revenues – primarily driven by Facebook’s Sponsored Stories and Twitter’s Promoted Tweets – will reach $5 billion in 2017, up from roughly $4.6 billion in the previous forecast.
Read MoreTop 10 Smart Phone Apps Of 2013 [CHART]
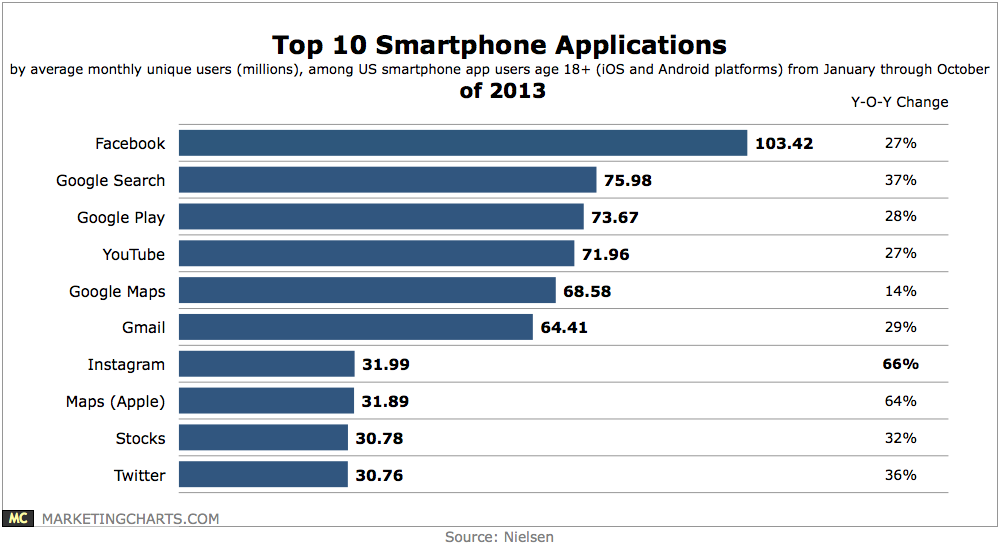
Facebook and Google are dominant among smart phone apps, accounting for 7 of the top 10.
Read MoreMillennials' Shared Online Experiences, December 2013 [CHART]
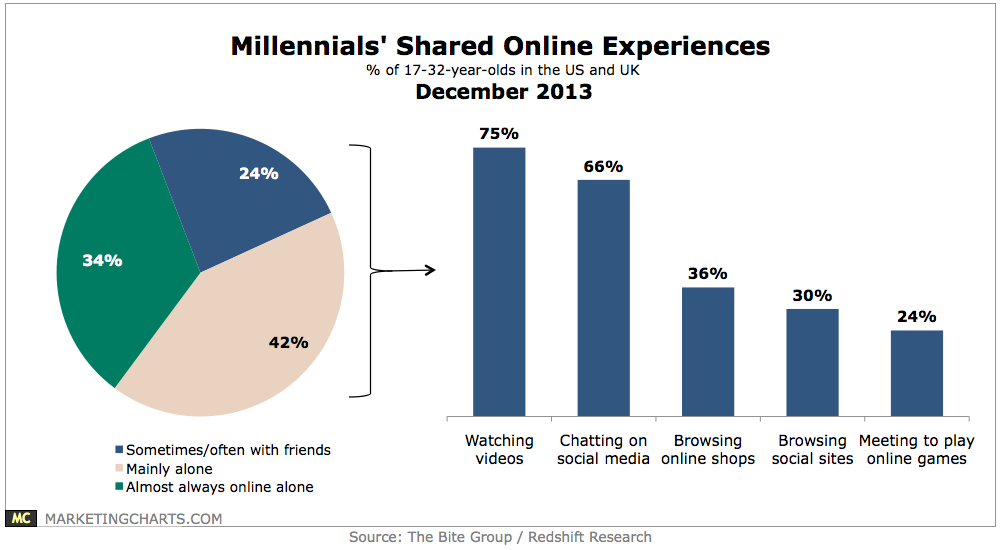
Two-thirds of Millennials said they share at least some social experiences online.
Read More