Content Marketing
2014 Marketing Technology Landscape [INFOGRAPHIC]
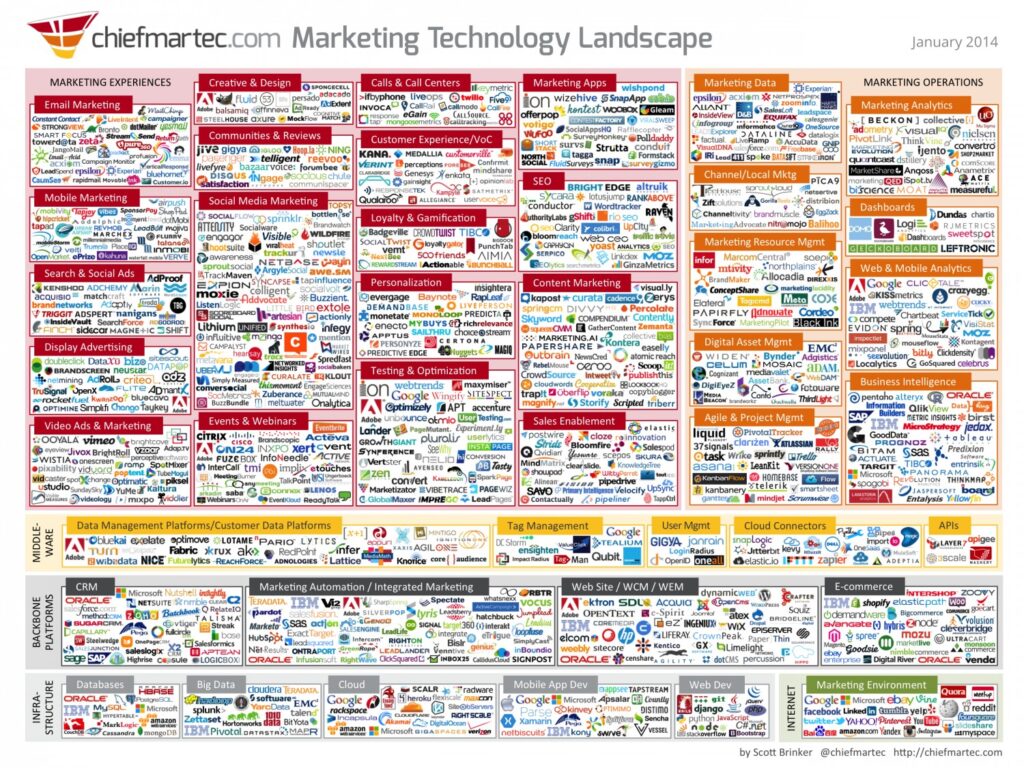
This infographic illustrates the marketing technology universe with 947 different companies that provide software for marketers.
Read More4 Types Of Content For Marketing [CHART]
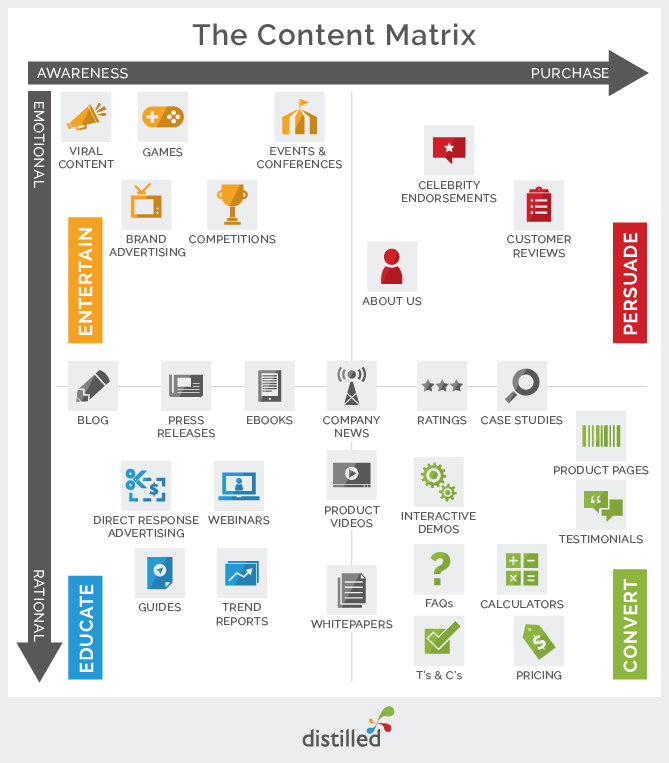
This superb chart by distilled breaks down content according to marketing goals, from awareness to purchase.
Read MoreTechnographic Generational Gap By Device, January 2014 [TABLE]
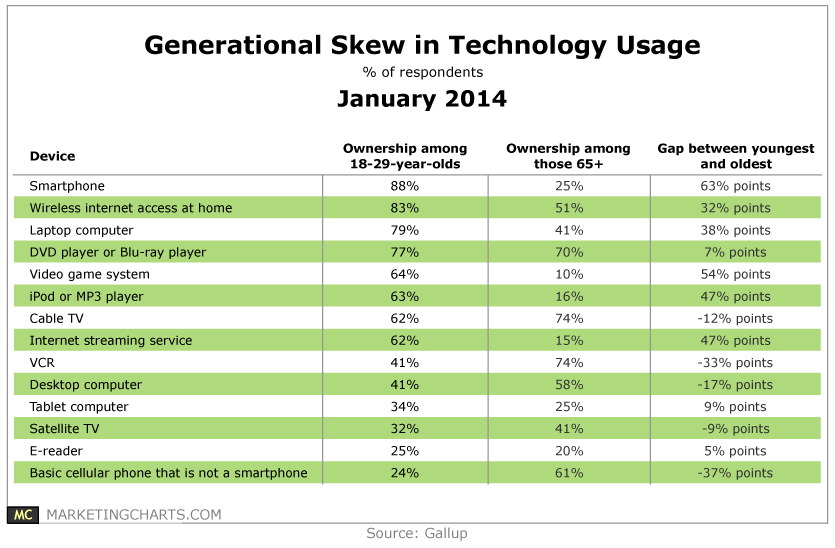
Gallup measured the penetration rates of 14 consumer electronic devices among 18-29-year-olds and those aged 65 and up.
Read MoreGlobal Over-the-Top Online Enabled Device Shipments, 2013 & 2017 [CHART]
Shipments of over-the-top (OTT) devices reached an estimated 1.67 billion worldwide in 2013.
Read MoreTV Viewing Via Cable Provider's App Or Website, January 2014 [CHART]
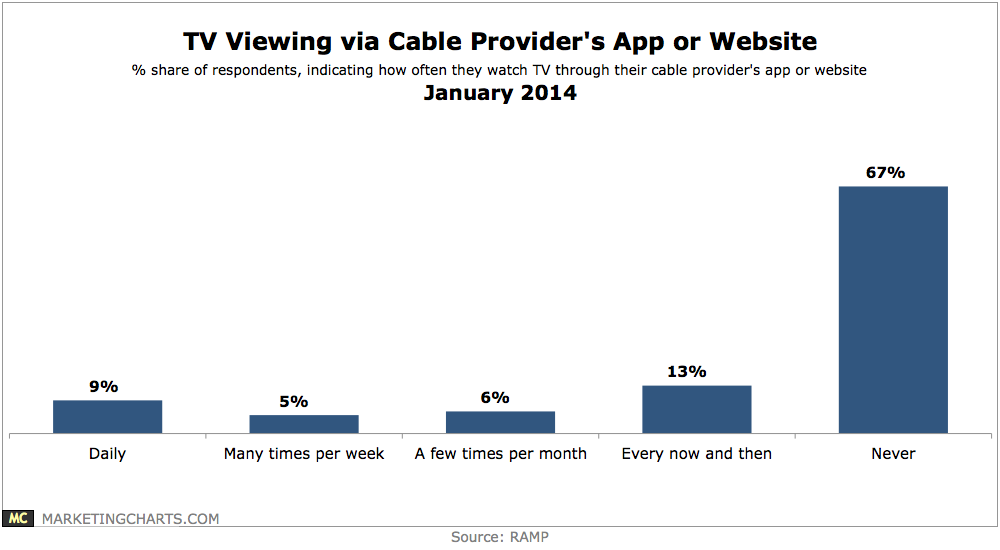
Some 80% of respondents are unaware of TV Everywhere.
Read MoreTop 5 Industries By Number Of Branded Video Views, Q3 2013 [CHART]
The top industry for such views was electronics, which ranked far ahead of runner-up mobile phones.
Read MoreGlobal Branded Video Views, Q3 2012-Q3 2013 [CHART]
Branded videos skyrocketed in viewership worldwide between the end of 2012 and 2013.
Read MoreUS Gaming Market Size By Screen, December 2013 [CHART]

170 million Americans play videogames, and 60% of those gamers spend money doing so, resulting in an estimated $20.5 billion in spending by the end of this year.
Read MoreEmail Subject Lines [INFOGRAPHIC]
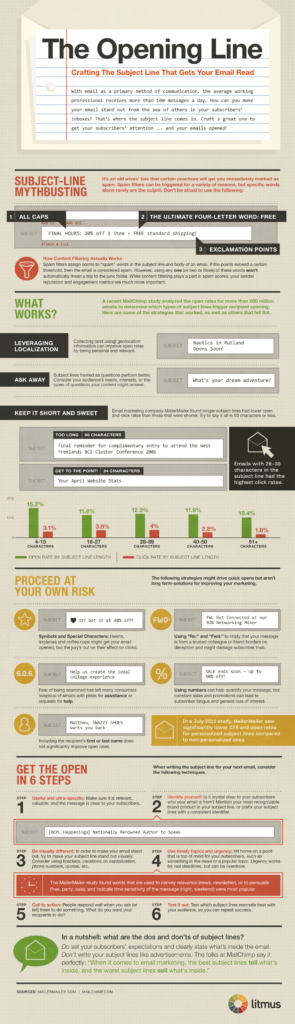
This infographic from litmus illustrates the various aspects of email subject lines.
Read MoreStreaming Video Services Used In North America, Q3 2013 [CHART]
Most respondents did not have any special subscription service to watch digital video content, but among those that did, Netflix was most popular.
Read More