Consumer Spending
Holiday Desktop eCommerce Spending, December 2014 [CHART]
eCommerce sales were up by 8.5% year-over-year, per IBM Digital Analytics, although average order values were down by 3.5%.
Read MoreWhat US Teens Buy, October 2014 [CHART]
What US teens buy: Half of teen spending is concentrated in 3 categories.
Read MoreUS Millennial Teens' Spending By Category, October 2014 [CHART]
Half of teen spending is concentrated in 3 categories.
Read MoreExpected Spending Habits By Generation, June 2014 [TABLE]
A slightly above-average proportion of millennials planned to reduce outlays on entertainment and eating out.
Read MoreConsumer Expenditures, 2012 vs 2013 [CHART]
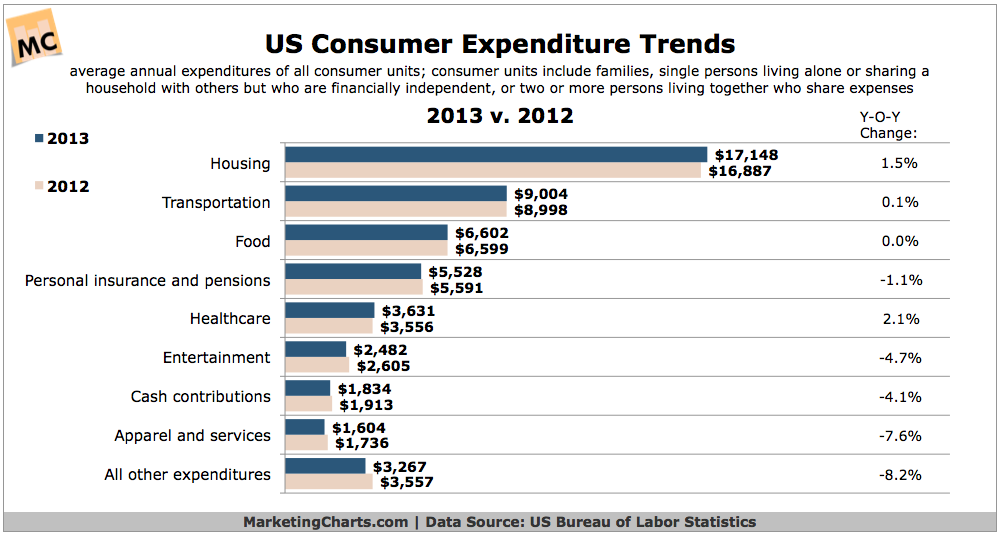
Consumers spent more on housing and transportation but less on apparel and entertainment in 2013, details the US BLS in a recent data release.
Read MoreAffluent Americans' Consumer Spending By Category, September 2014 [CHART]
Some 67.5 million American adults lived in a household with annual income of at least $100,000, a 5 million (or 8%) increase from last year.
Read MoreHoliday-Related Retail Spending, 2004-2014 [CHART]
The NRF is forecasting an increase in holiday spending of 4.1% this year to $616.9 billion in total sales, with online sales growth in the 8-11% range.
Read MoreUS College Students' Back-To-School Purchase Influences, August 2014 [TABLE]
Some 93.6% of college students said they found one-on-one recommendations from friends at least somewhat influential.
Read MoreUS College Students' Change In Discretionary vs . School-Related Spending, August 2014 [CHART]
College students might not be as broke as we think, but a significant portion of them plan to spend less this year than they have previously—particularly on school-related items.
Read MoreAverage Back-To-School Spending Among Parents By Category, 2012-2014 [TABLE]
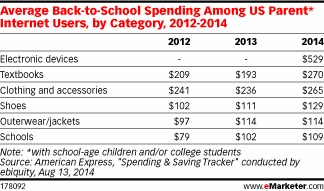
Among US parent internet users with school-age children and/or college students, average back-to-school spending on electronic devices was $529.
Read More