Technographics
How Americans Used Mobile For Holiday Shopping, 2011 & 2012 [CHART]

More than eight in 10 smart phone owners researched and browsed for products on their phone, up 15 percentage points from 2011.
Read MoreMary Meeker 2013 Trends [PRESENTATION]
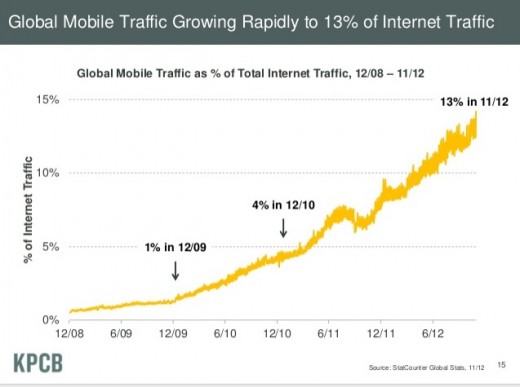
Analyst Mary Meeker illustrates that mobile and tablets are driving new levels of connectivity, particularly in emerging markets.
Read MoreeMoney [INFOGRAPHIC]
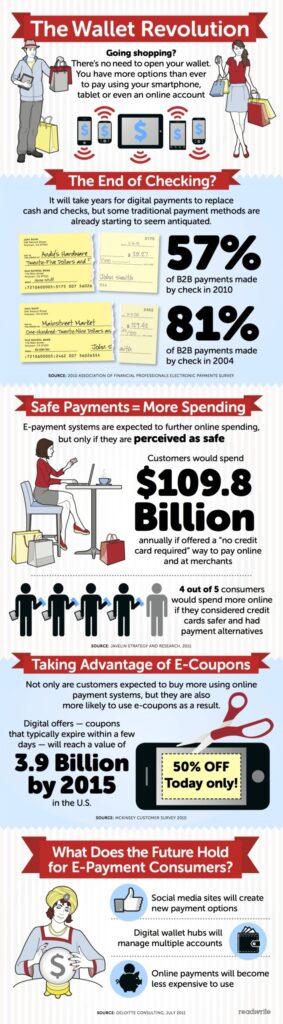
This ReadWrite infographic offers some key data points on the path to digital money.
Read MoreThe Ages Of Social Media [INFOGGRAPHIC]
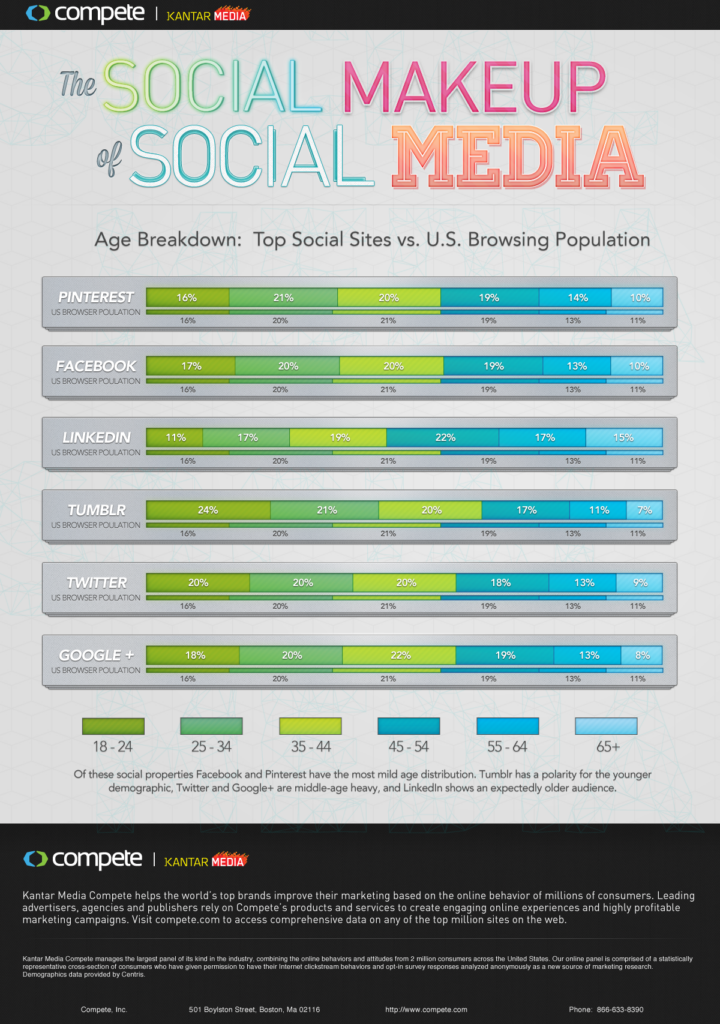
This infographic by Compete illustrates the age breakdown of the top social media sites.
Read MoreTime Spent Online By Activity & Device, 2012 [CHART]
Social media captures 31% of smartphone internet time, compared to 18% of PC internet time.
Read MoreTime Spent Online By Device, 2011 vs 2012 [CHART]
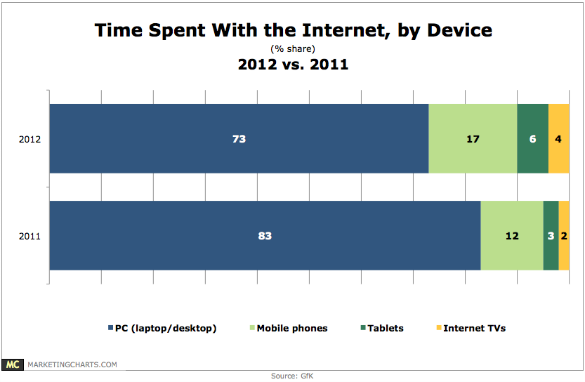
While desktop and laptop computers accounted for 83% of total time spent online last year, that dropped by 10% points to 73% this year.
Read MoreDevice Dependence By Age, December 2012 [CHART]

78% of 18-29-year-old social media users are very or extremely dependent on their mobile phones.
Read MoreConsumer Interest In Interactive TV, December 2012 [CHART]
35% of respondents indicated an interest in real-time games and challenges with shows via a second screen.
Read MorePrimary News Sources Of Mobile Users, September 2012 [TABLE]
A June survey from Pew put digital just 16 percentage points behind TV as the source where US news consumers got their news.
Read MoreTravel & Leisure Search Advertising Click Share By Device, Q3 2011- Q3 2012 [CHART]
40% of US online travel consumers entered the purchase funnel through search engines.
Read More