Technographics
Change In Facebook Users' Activities By Device, Q1 2013 [TABLE]
Watching videos on Facebook saw among the biggest jumps in usage, with viewing increasing by 47% on both PC and mobile, and nearly doubling on the tablet.
Read MoreSecurity Measures Not Taken By Smart Phone Owners, May 2013 [TABLE]
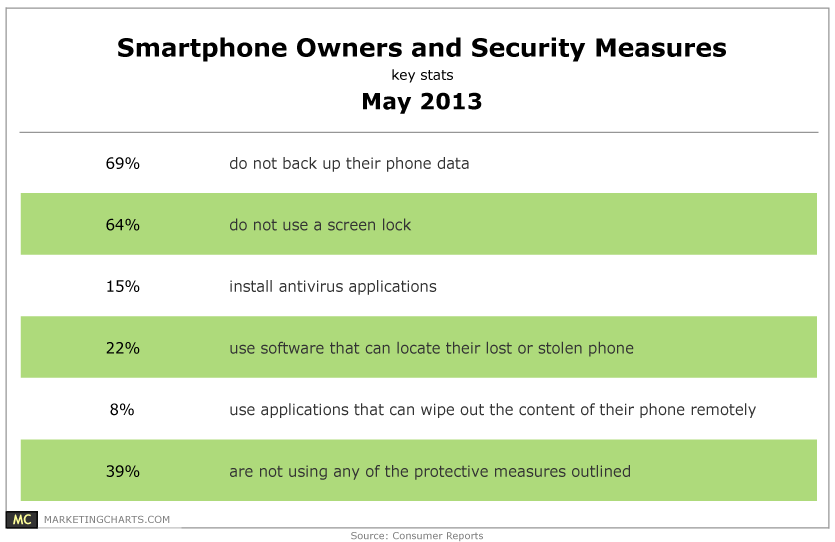
Only 22% of smart phone users have installed an application to locate a missing phone.
Read MoreSmart Phone Penetration, October 2011 – March 2013 [CHART]
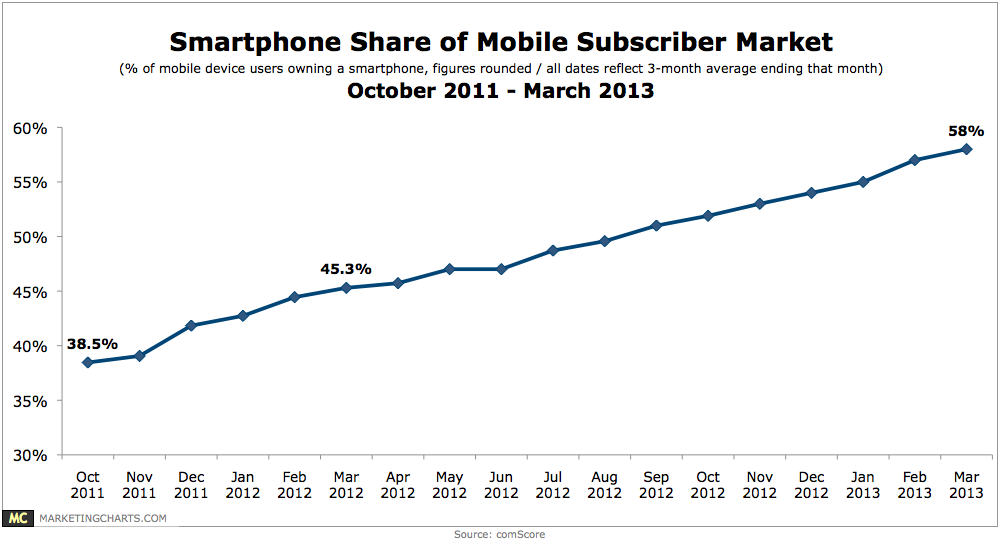
During the 3-month period ending in March, smart phone penetration reached 58% of the mobile market, up a percentage point from the prior month and almost 30% year-over-year.
Read MoreMost Popular Gaming Devices Of Tablet Owners, May 2013 [CHART]
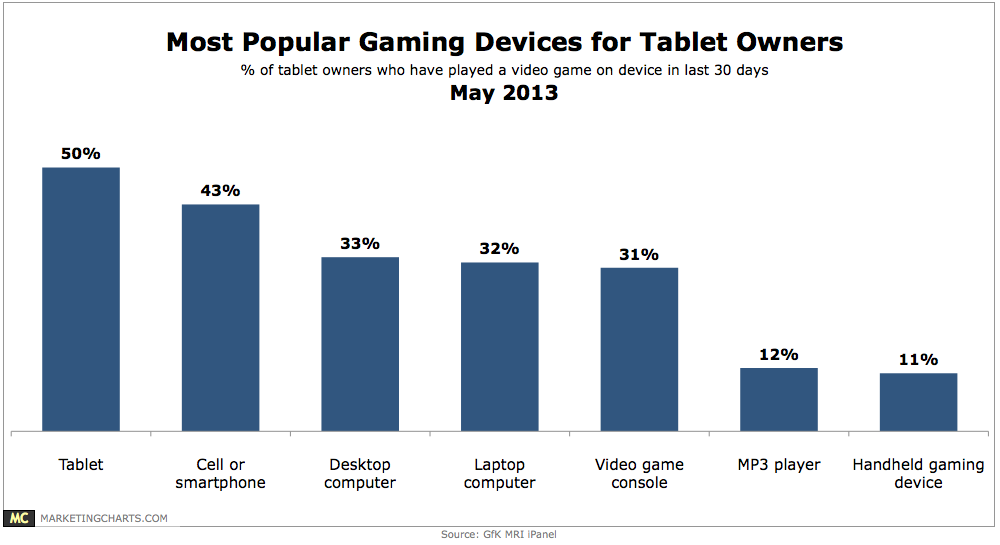
50% of tablet owners played a video game on their device in the past 30 days.
Read MoreAverage US Search CPC By Device, Q1 2013 [TABLE]
The computer still garnered the highest CPC rates in the US, at 56 cents in Q1 2013, while the phone was a comparatively inexpensive 30 cents per click.
Read MoreMobile Path To Purchase, May 2013 [TABLE]
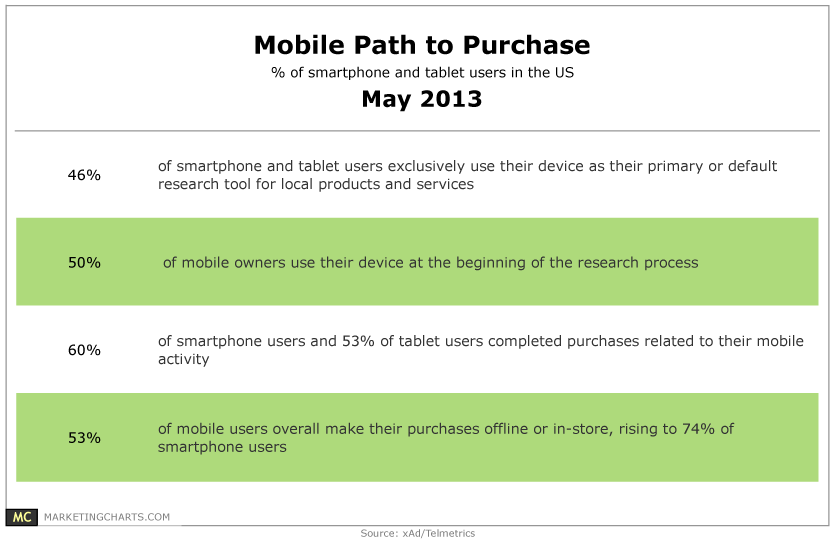
46% of mobile users use their device exclusively as their primary tool aiding their local purchase decisions, with the remainder leveraging other media sources such as the PC.
Read MoreGlobal Share of Mobile Real-Time Bidding Ad Views By OS, Q1 2013 [CHART]
In-app advertising accounted for the bulk of mobile RTB ads, at 93% of ads viewed. Browsers accounted for the remaining 7%.
Read MoreGlobal Share of Mobile Real-Time Bidding Ad Views By Device, Q1 2013 [CHART]
In Q1 2013 that tablets accounted for 46% of mobile RTB ads viewed worldwide, compared with 54% viewed on smart phones.
Read MoreTop Mobile Shopping App Features, December 2012 [CHART]
Smart phone and tablet users said money-saving offers were the most important characteristics of apps.
Read MoreSenior Execs' Use Of Mobile, April 2013 [CHART]
Tablet adoption in particular has jumped, doubling in a year to 6 in 10 respondents, with use growing across all age groups.
Read More