Media Consumption
Google's Universal Search [INFOGRAPHIC]
This infographic from Search Metrics illustrates their study of Google’s Universal Search results.
Read MoreNews Consumption Time By Device, March 2013 [CHART]
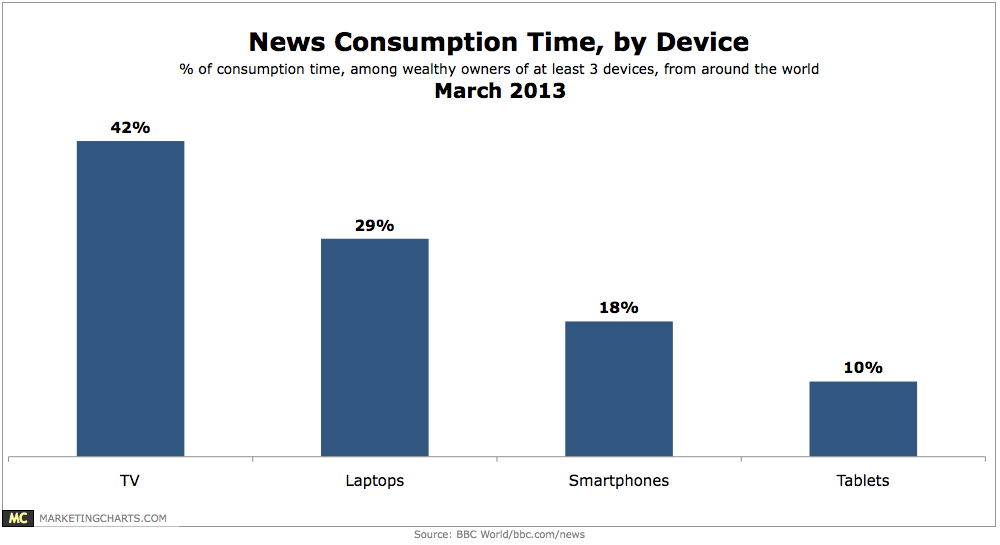
TV is still the primary device for news consumption, at 42% of respondents’ time, compared to 29% for laptops, 18% for smartphones, and 10% for tablets.
Read MoreVideo Consumption By Platform & Generation, Q4 2012 [TABLE]
In Q4 2012, seniors averaged 220 hours and 55 minutes per month watching traditional TV.
Read MoreTop News Sites By Facebook Interaction, September 2012 [CHART]
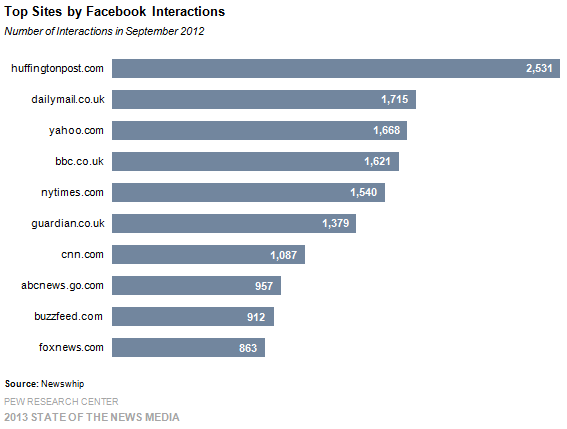
In terms of Facebook interactions, HuffPost beat out more traditional companies, such as The Daily Mail, The New York Times, and CNN.
Read MoreAmericans’ Favorite Media Activities By Generation, March 2013 [CHART]

64% of Americans rank watching TV (on any device) as one of their top-3 media activities, down from a high of 71% in 2009 and 2010 but enough to keep TV viewing as America’s favorite media activity.
Read More
Millennial Early Adopters' Media Use, March 2013 [CHART]
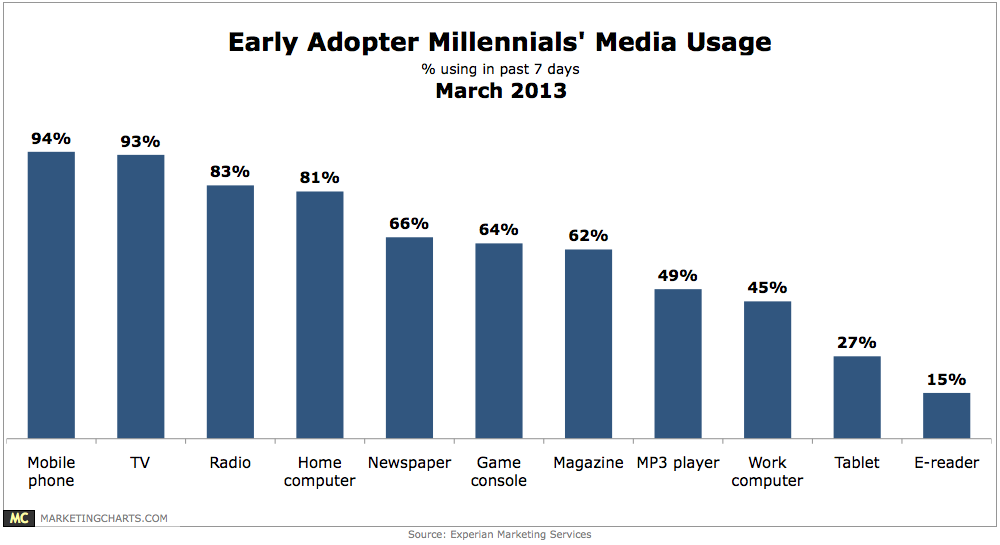
52% of Millennials are above-average in terms of their adoption of technology, and these early adopters are heavily reliant on their mobile devices.
Read MoreTraditional Television Viewing By Generation, Q1 2011 – Q4 2012 [TABLE]
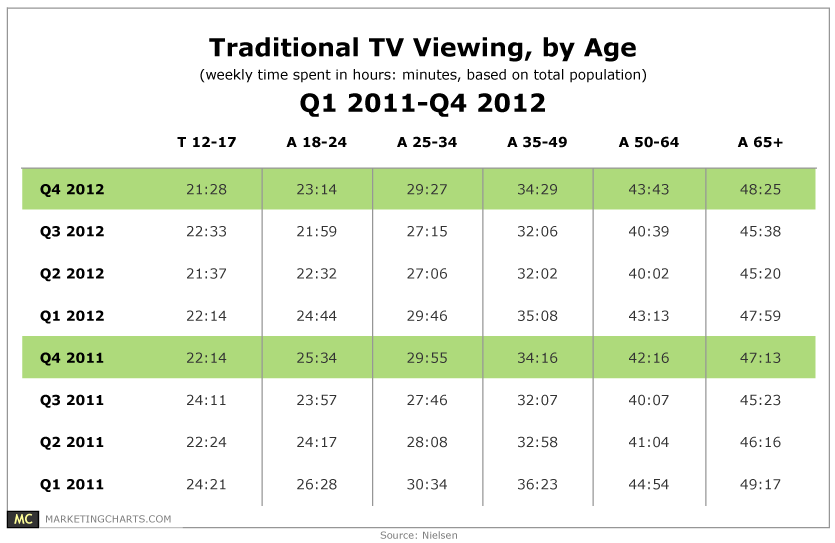
Traditional television consumption is dropping by a larger amount every quarter, but it’s still not a seismic shift.
Read MoreAmericans' Awareness Of News Industry’s Financial Woes, March 2013 [CHART]
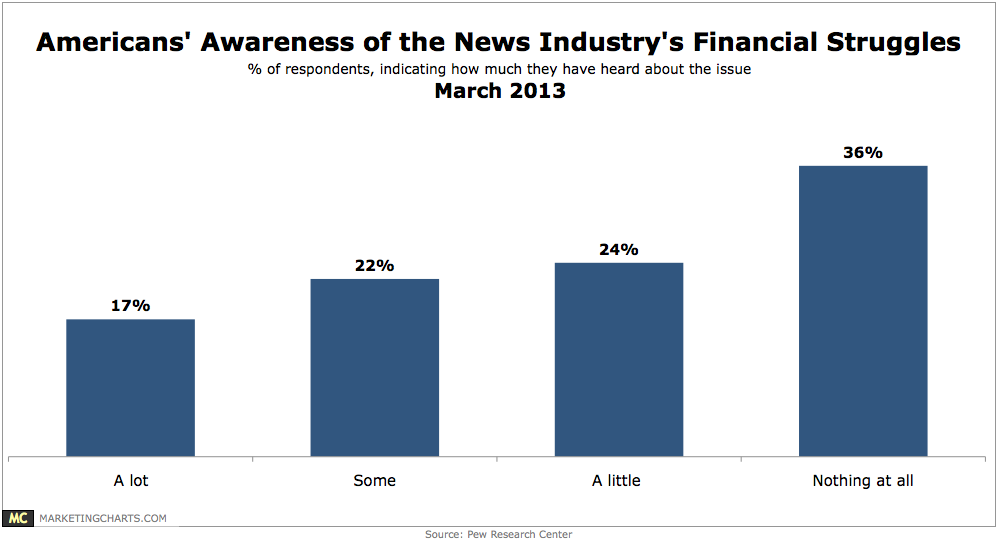
Fully 31% of respondents reported having stopped turning to a particular news outlet because they felt it was no longer providing them with the news and information they were accustomed to getting.
Read MoreNews Audience Trends, 2011 vs 2012 [CHART]
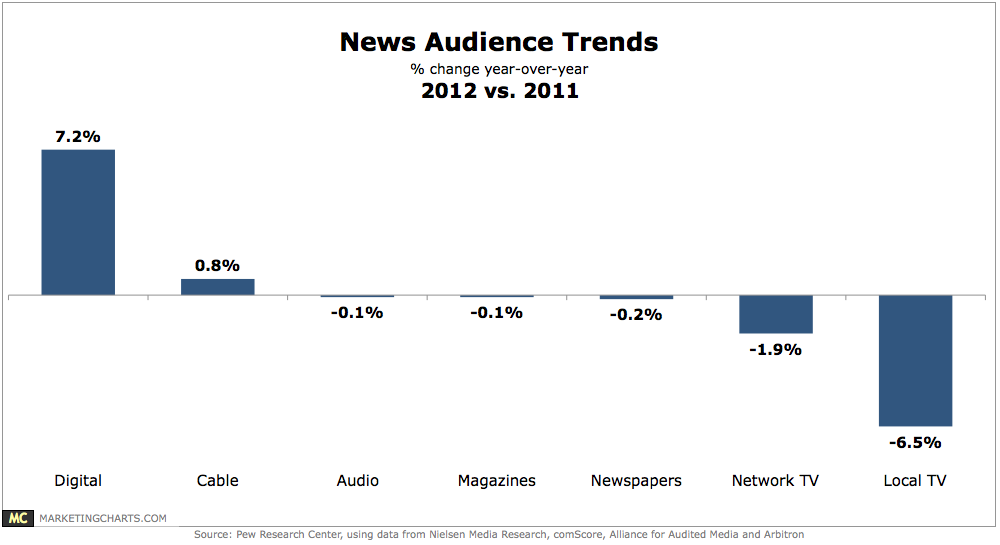
Local TV saw a significant 6.5% drop in audience size between 2011 and 2012, finds Pew Research Center’s Project for Excellence in Journalism in its State of the News Media 2013 study.
Read More