Consumer Attitudes
Barriers To Live Online Video Viewing [CHART]
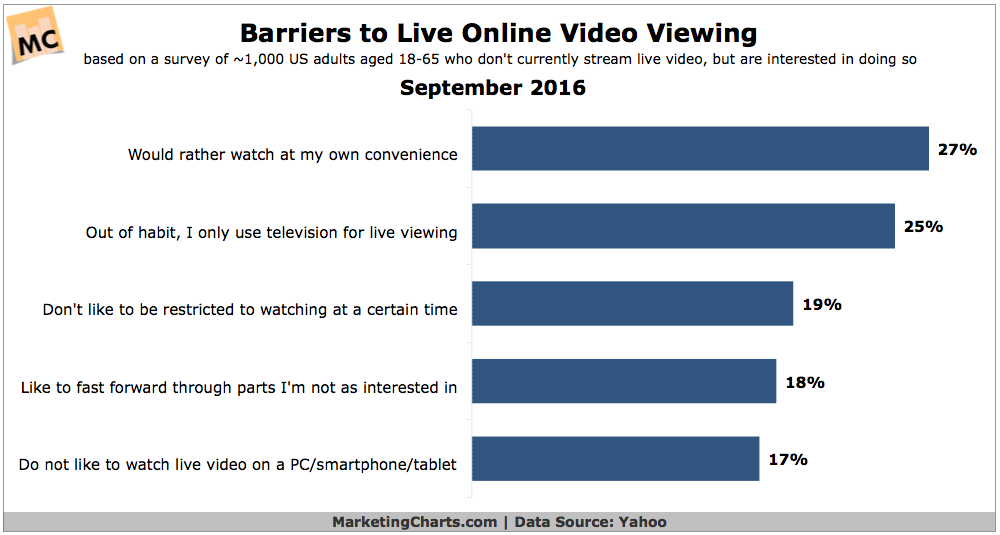
Legacy TV doesn’t only need to contend with the rapid ascent of subscription video-on-demand services, it also needs to face a new challenger: live video online.
Read MoreGlobal Expectations Of Trump Regime [CHART]
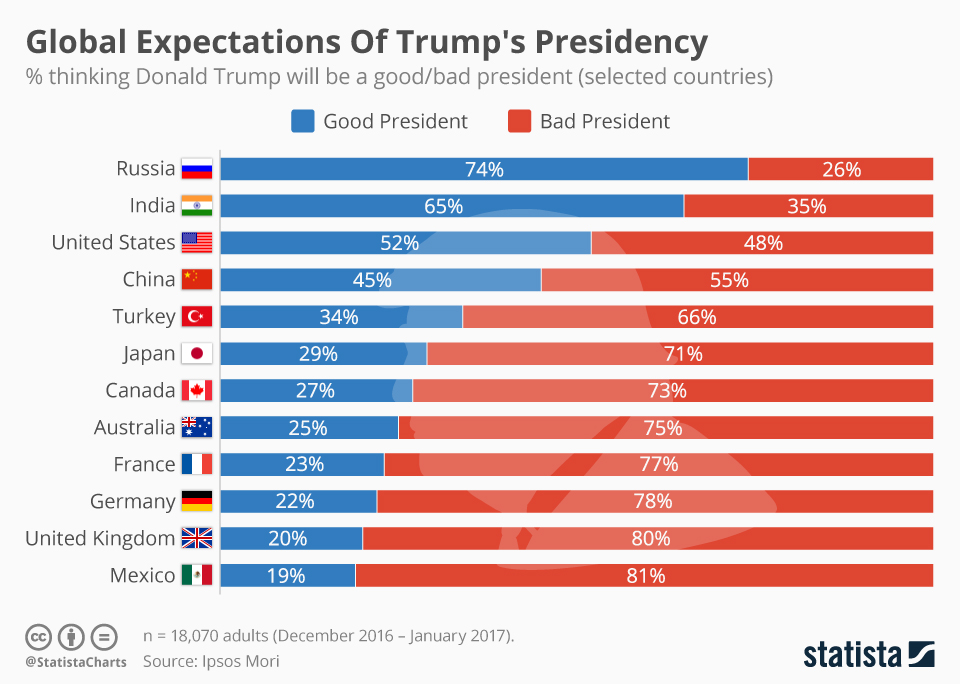
The majority of countries worldwide have low expectations of Donald Trump’s impending stint in the White House.
Read MoreSocial Media Influence On TV Viewing Decisions [CHART]
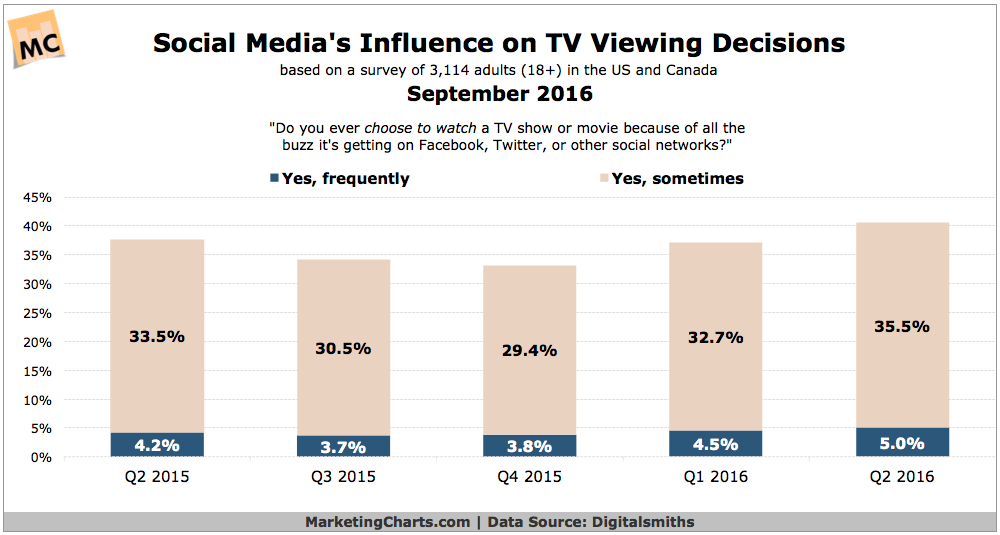
Slightly more than 4 in 10 adults in the US and Canada profess to choosing a TV show or movie at least sometimes because of the buzz it’s getting on social media.
Read MoreAnnoying Social Media Interactions By Brands [CHART]
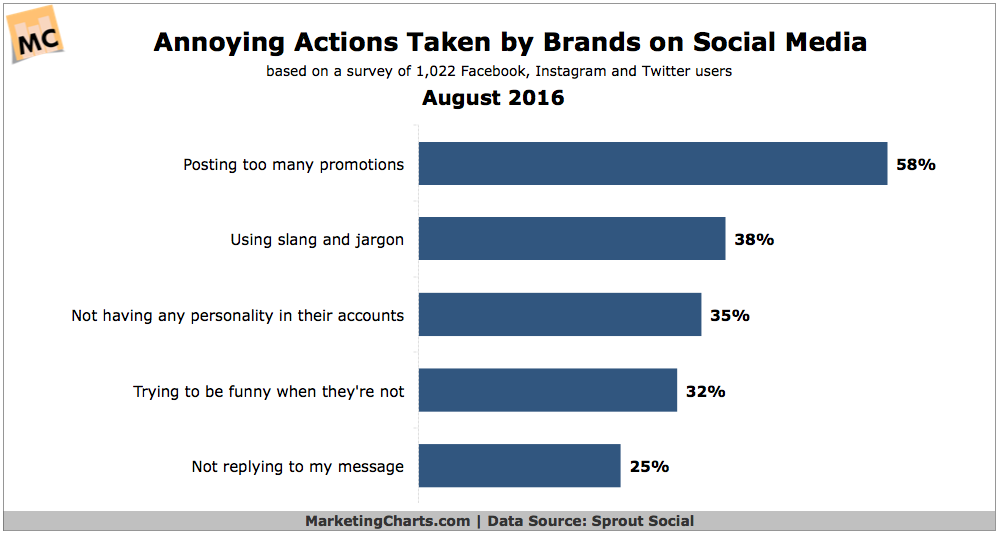
A recent study from Sprout Social shows that brands need to strike a very delicate balance with their social media promotions or risk losing their followers.
Read MoreAttitudes Toward Advertsing Formats By Generation [INFOGRAPHIC]
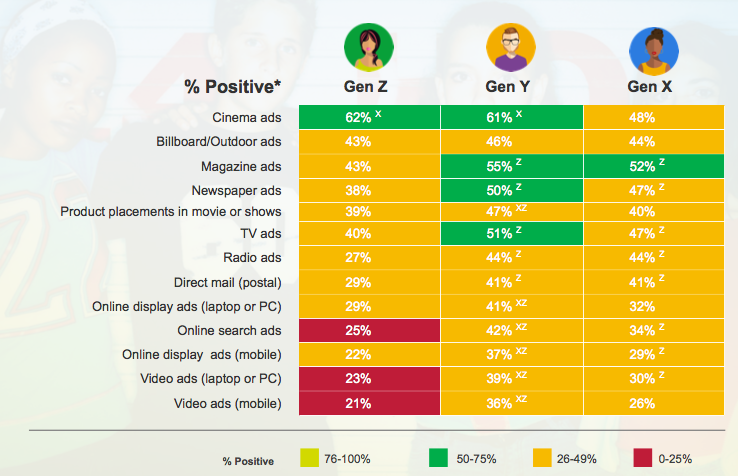
The dislike of cinema advertising by Gen Xers may be explained by the fact that they grew up watching movies before the introduction of cinema advertising.
Read MoreMillennials' Response To YouTube Ads [CHART]
How engaged with YouTube ads are millennials?
Read MoreUS Marijuana Use [MAP]
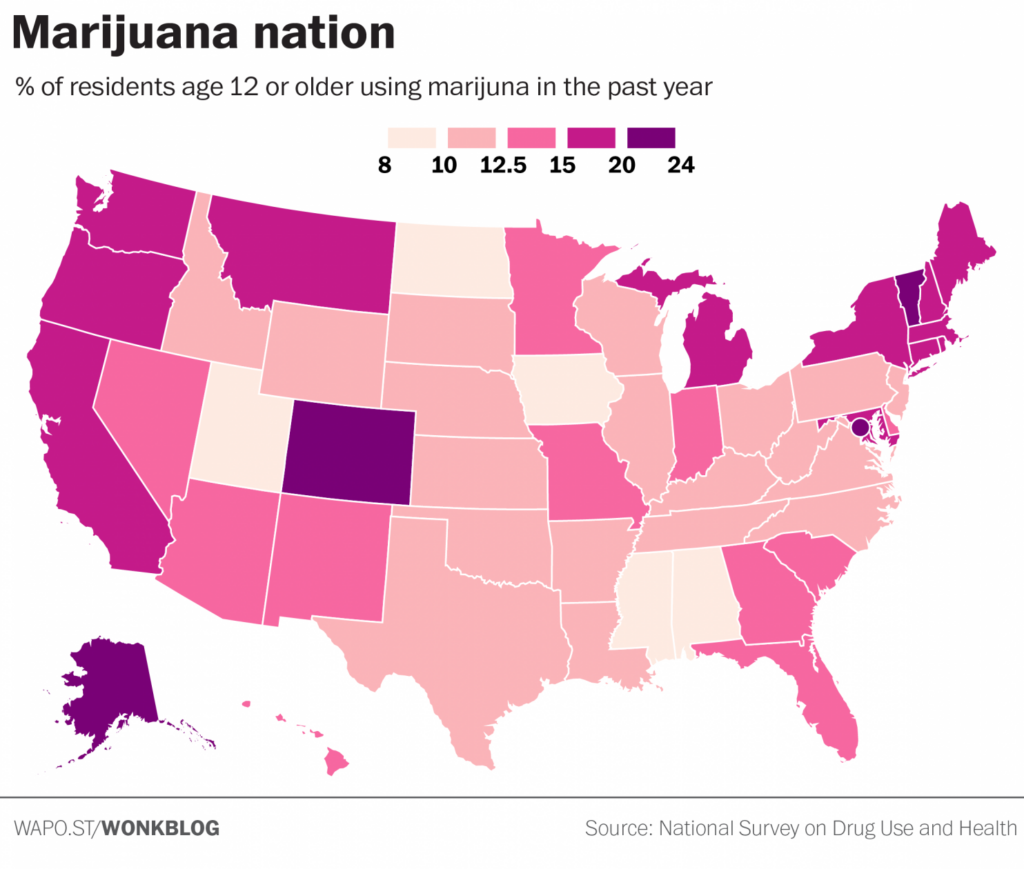
8.3% of Americans age 12 and over — 22 million people — used marijuana on a monthly basis in 2015.
Read MoreConsumer Ratings Of Industries & Sectors [CHART]
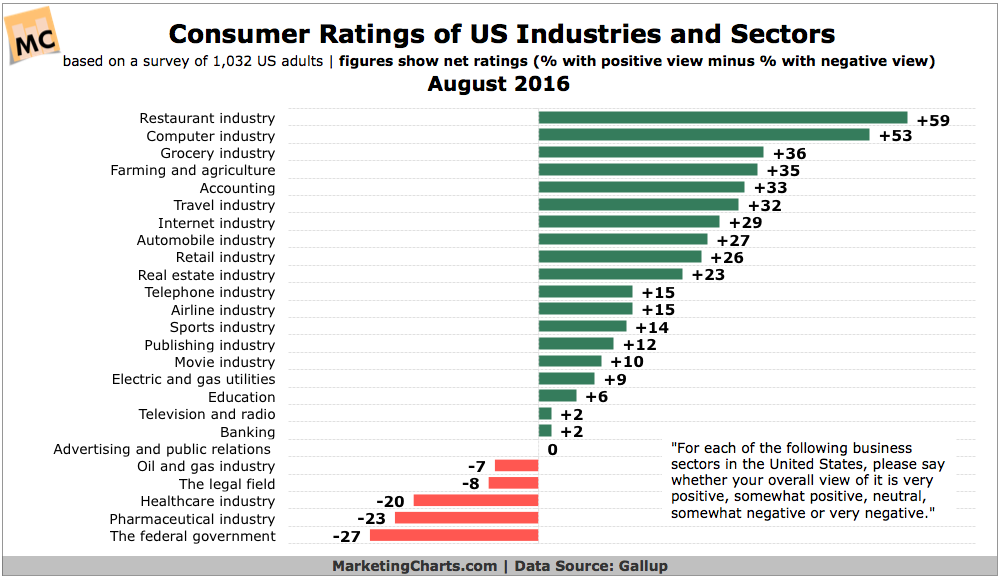
The restaurant and computer industries enjoy the best net perception among US adults.
Read MoreAmericans' Alcohol Consumption & Preferences [CHART]
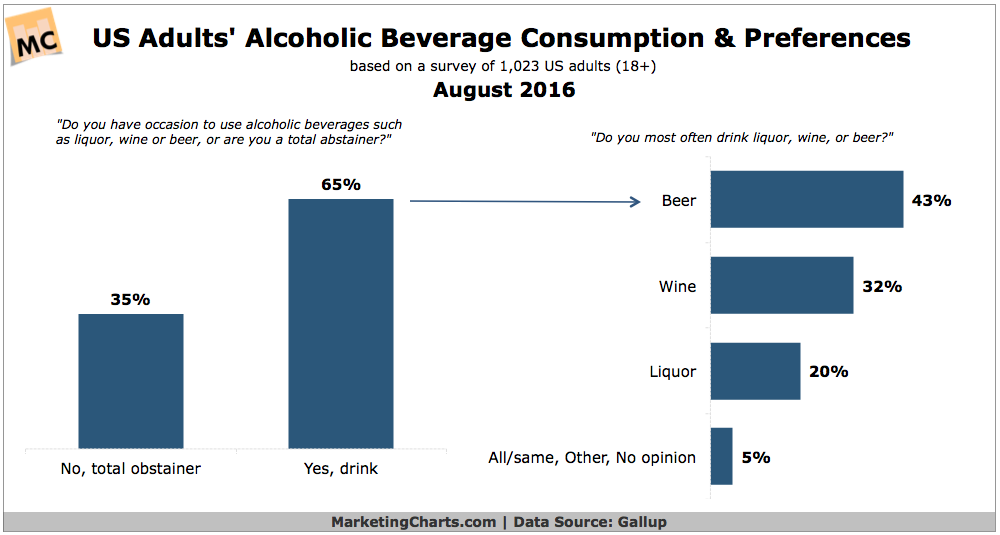
Almost two-thirds (65%) of American adults drink alcoholic beverages on occasion, well within the 55-71% range observed over the past 70-odd years.
Read MoreAmericans' Historic Touchstones By Political Party [TABLE]
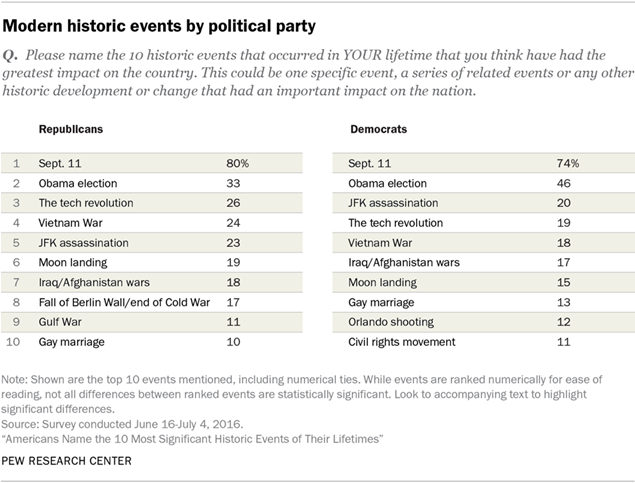
The events in American history named by Republicans and Democrats overlap substantially, and differences between the two parties are primarily a matter of degree.
Read More