B2B Marketing
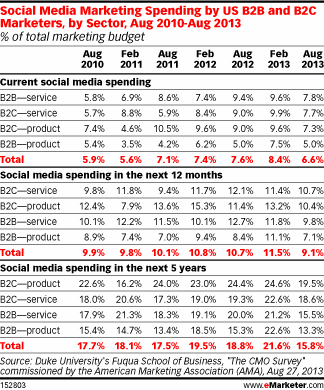
B2B & B2C Social Media Marketing Spending, August 2010 – August 2013 [TABLE]
In August 2013, social ad spending accounted for an average of about 6.6% of marketer budgets.
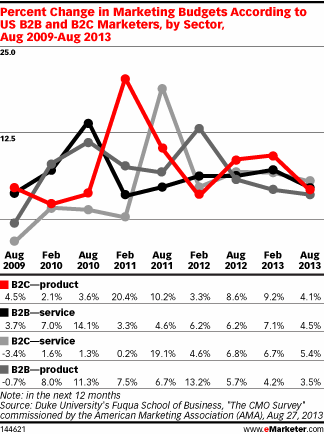
Read MoreChanges In B2B & B2C Marketing Budgets, August 2009 – August 2013 [CHART]
In total, marketers anticipated in August 2013 that the total ad spend growth rate for the following 12 months would reach 4.3%.
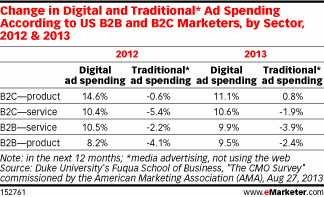
Read MoreChanges In B2B & B2C Ad Spending, 2012 & 2013 [TABLE]
Marketers from B2C product companies expected digital ad spending to rise 11.1% this year, compared to 14.6% last year.
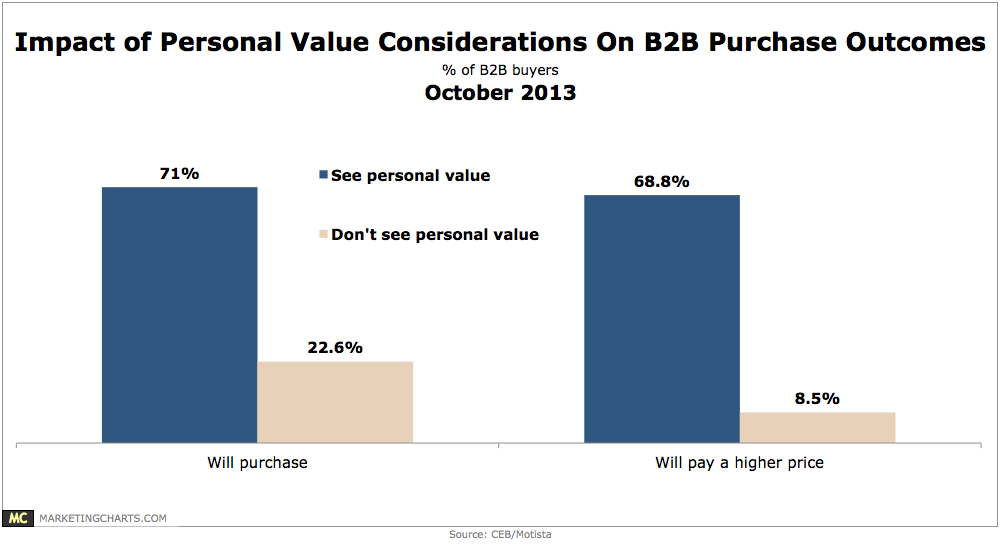
Read MoreEffect Of Personal Value Perceptions On B2B Purchases, October 2013 [CHART]
Those who see personal value are more than 3 times as likely to say they would make a purchase than those who do not recognize any personal value (71% vs. 22.6%).
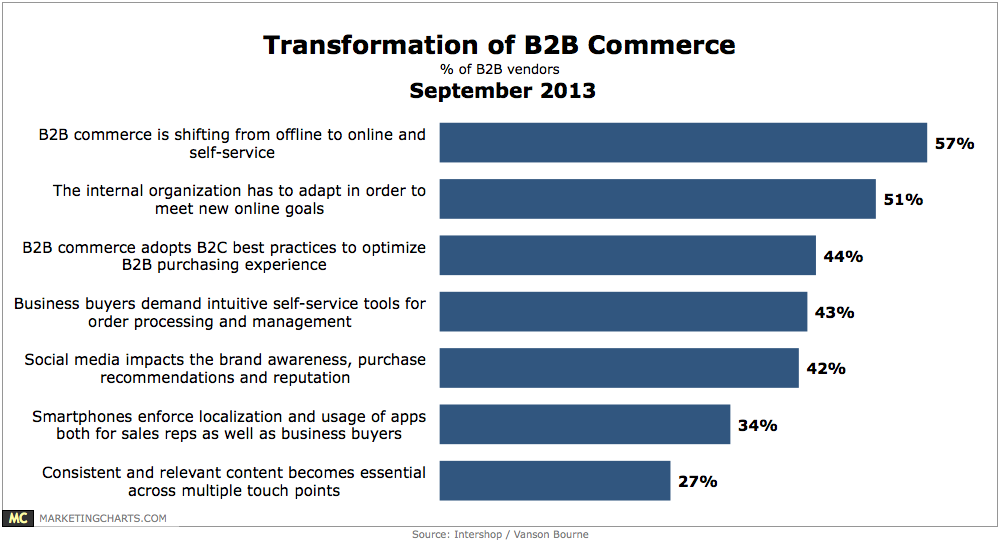
Read MoreTransformation Of B2B Commerce, September 2013 [CHART]
B2B commerce is shifting offline to online and self-service, say 57% of B2B vendors from the US and Europe.
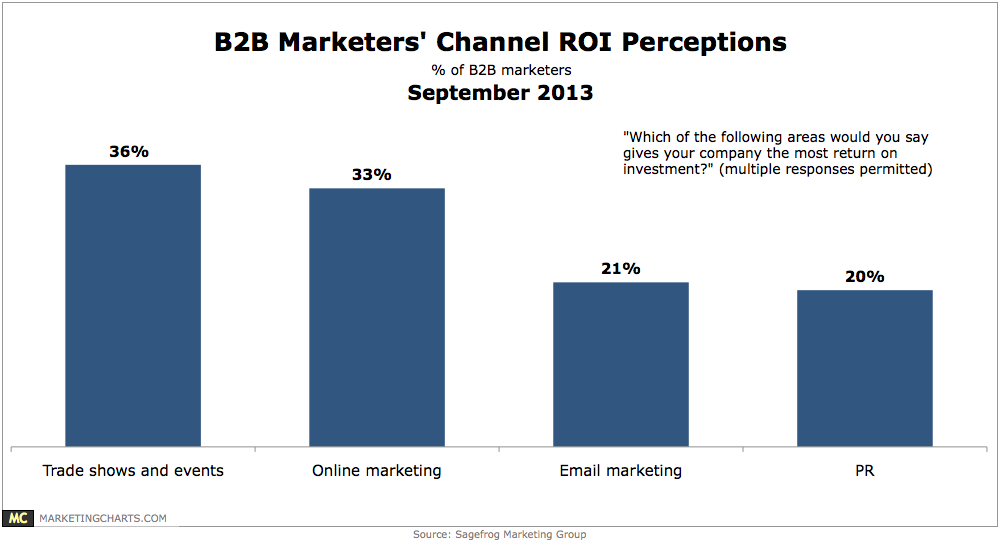
Read MoreB2B Marketers Perceptions Of ROI By Channel, September 2013 [CHART]
B2B marketers hold trade shows and events in high regard when it comes to their return on investment .
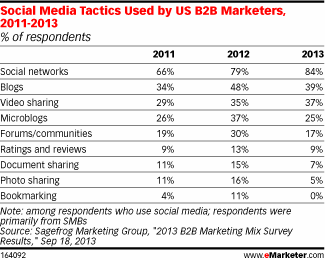
Read MoreB2B Social Media Tactics, 2011-2013 [TABLE]
Eighty-four percent of B2B marketers used social networks this year, up from 79% in 2012, while both blogs and microblogs saw a decline in B2B use this year.
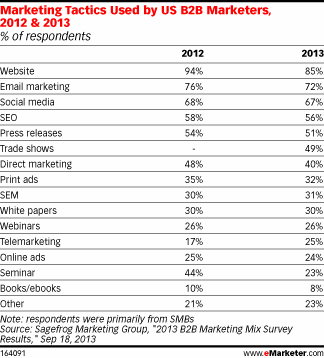
Read MoreB2B Marketing Tactics, 2012 & 2013 [TABLE]
Websites were the most uniformly employed technique, used by 85% of those polled.
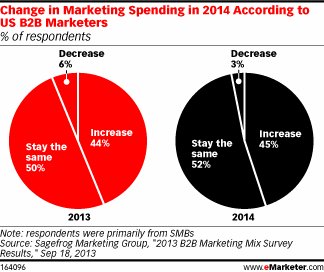
Read MoreChange In B2B Marketing Spending For 2014 [CHART]
45% of marketers expected to see an increase in budgets in the next year, while 52% thought their outlays would remain the same.
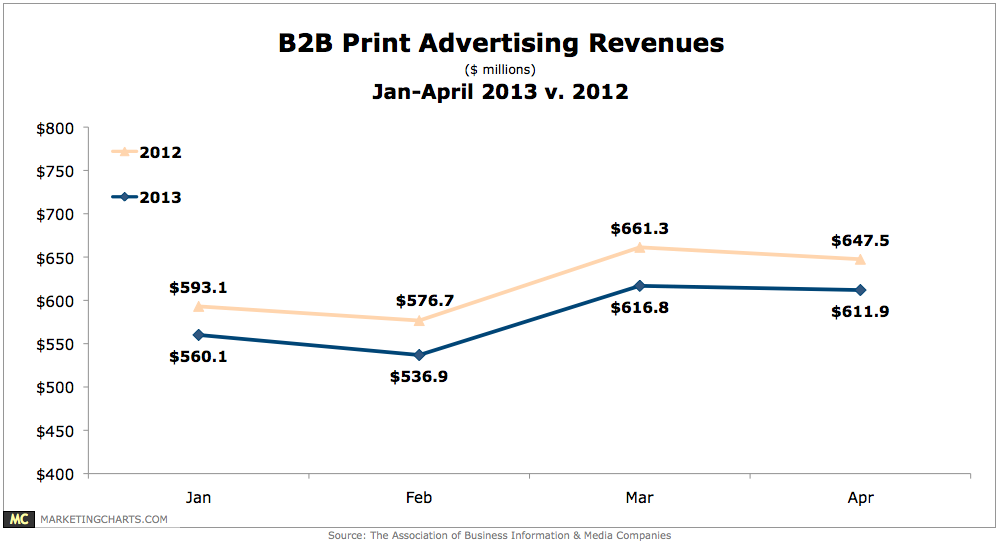
Read MoreB2B Print Ad Revenues, 2012 vs 2013 [CHART]
After declining by 4.8% last year, total Q1 ad sales this year dropped by 6.2%, from $1.83 billion to $1.72 billion.
Read More