Marketing Analytics
Marketing Procurement Metrics, June 2013 [CHART]
The metrics most widely used by marketing procurement professionals today differ from those they believe should ideally be used.
Read MoreTop Customer Experience Tools, June 2013 [CHART]
9 in 10 CMOs say they are personally responsible for the overall customer experience for their brand.
Read MoreSMBs Digital Marketing Objectives, March 2013 [CHART]
SMBs kept their goals for digital marketing simple: Driving sales and increasing brand awareness were No. 1 and No. 2, respectively.
Read MoreGlobal Facebook Advertising Performance Metrics By Industry, March 2013 [TABLE]
For overall Facebook ads served by industry, sports cost by far and away the most, at a CPM of $9.08.
Read MoreGlobal Facebook Cost Per Like By Industry, March 2013 [TABLE]
General retail and telecommunications had the most success generating page “likes,” at a rate of 0.11% and 0.10%, respectively.
Read MoreGlobal Facebook Ad Performance Metrics By Type, March 2013 [TABLE]
The sponsored check-in story achieved the highest clickthrough rate (CTR) by a significant margin.
Read MoreAd Viewability Benchmarks By Site Type, 2012 [CHART]
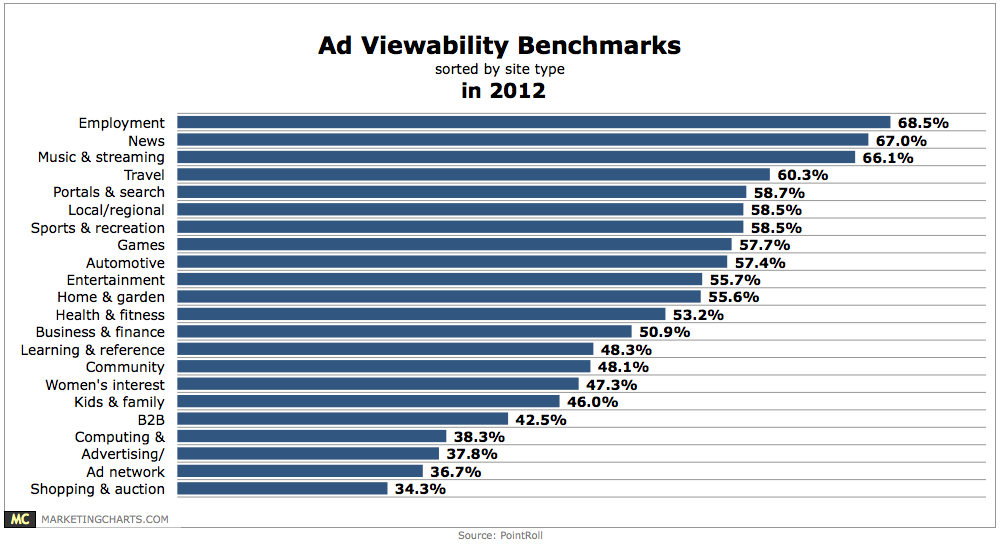
Covering 2012 activity, the data shows that viewability rates were lowest on shopping and auction (34.3%) and ad network (36.7%) sites, and highest on employment (68.5%), news (67%) and music and streaming media (66.1%) sites.
Read MoreOnline Video Ad Views, December 2011 – May 2013 [CHART]
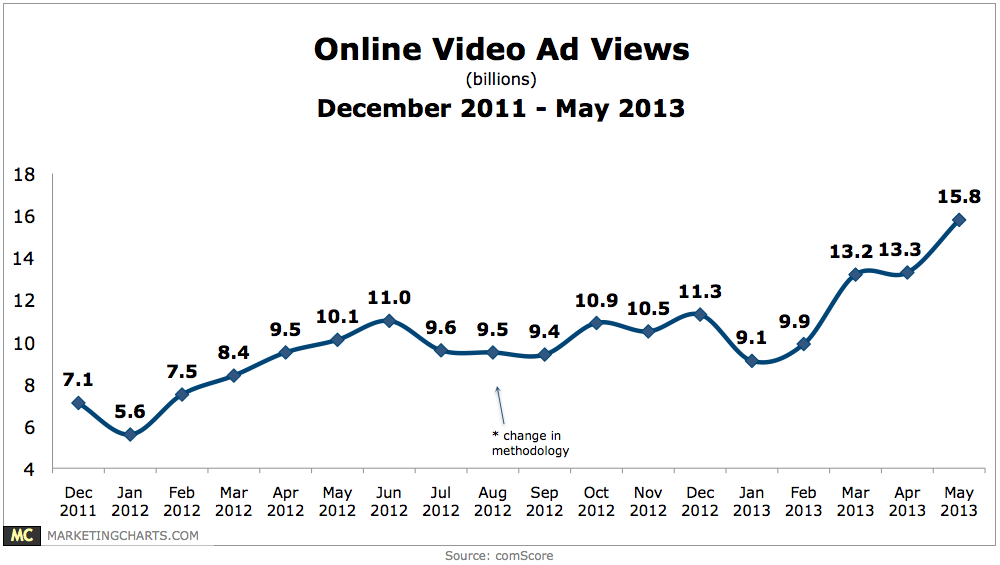
In May, Americans watched an average of 96.5 ads each, up significantly from 81.6 the prior month.
Read MoreReach & Frequency Of Video Ads, January – May 2013 [CHART]
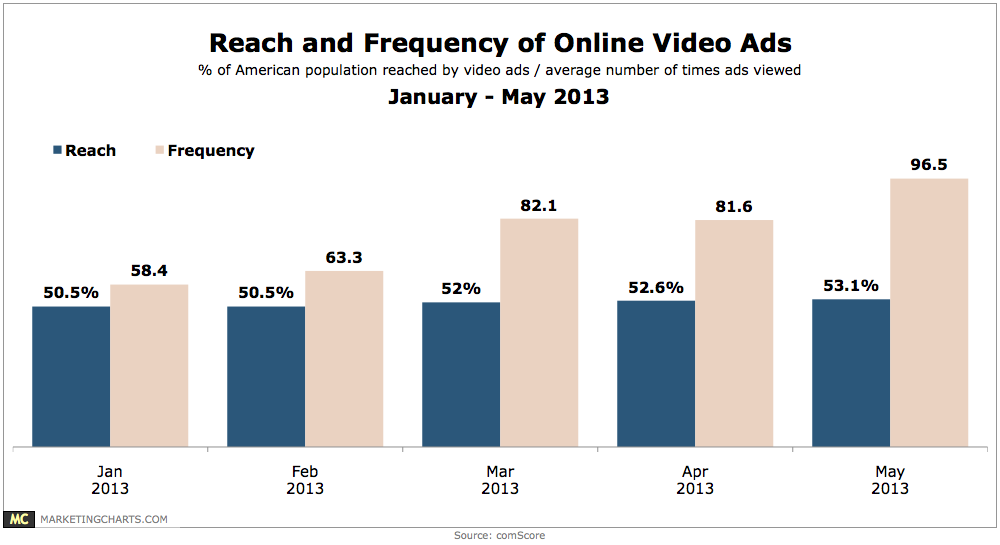
About 53% of the US population watched online video ads in May, relatively unchanged from April’s 52.6%.
Read MoreMedia & Entertainment Strategic Priorities During Digital Transformation, June 2013 [CHART]
Digital’s share of top-line revenue is expected to grow from 47% on average this year to 57% by 2015.
Read More