Advertising
Branded Content Spending Trends in 2013 [TABLE]
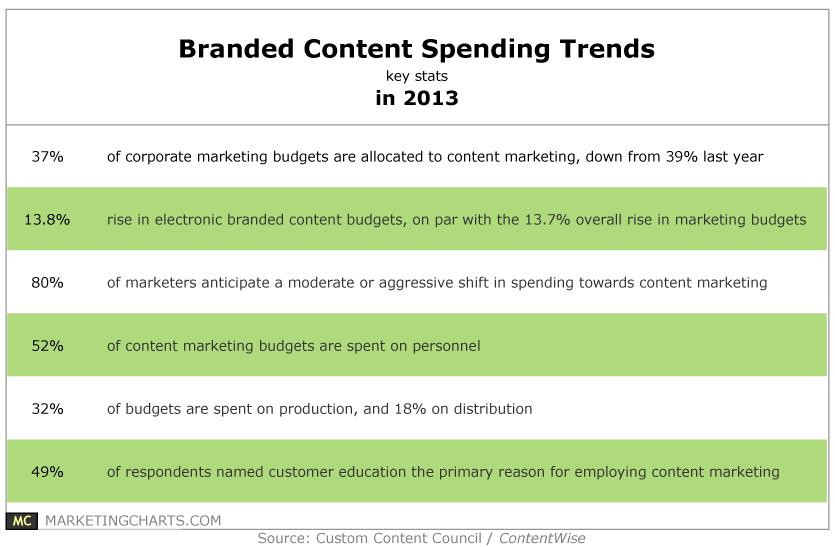
Corporations spent on average 37% share of their marketing budgets this year on branded content.
Read MoreGlobal Ad Spending Share By Medium, 2013 vs 2016 [CHART]
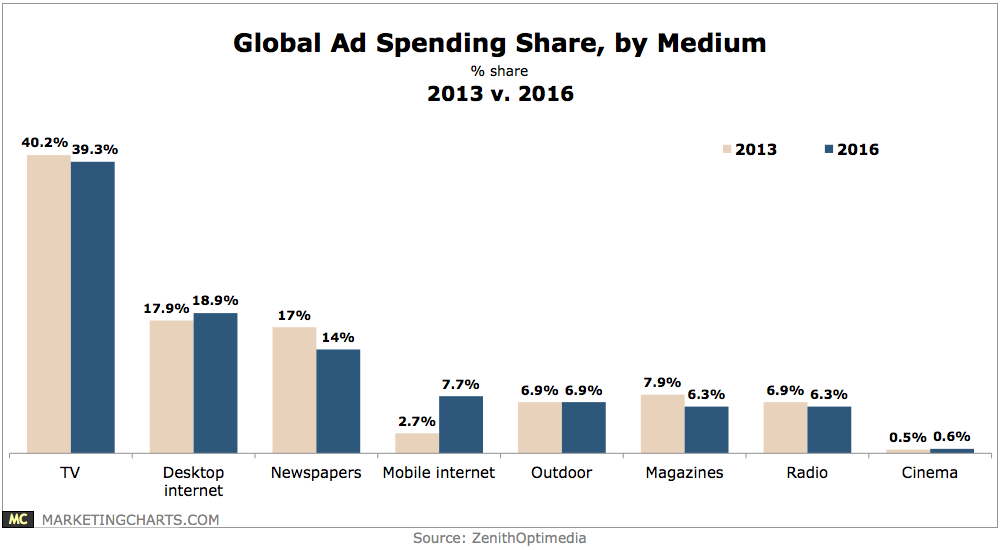
ZenithOptimedia predicts mobile advertising will generate more new ad spending ($31.8 billion) than TV ($29.8 billion) from this year through 2016.
Read MoreOnline Video Ad View Share By Device & Content Duration, Q3 2013 [CHART]
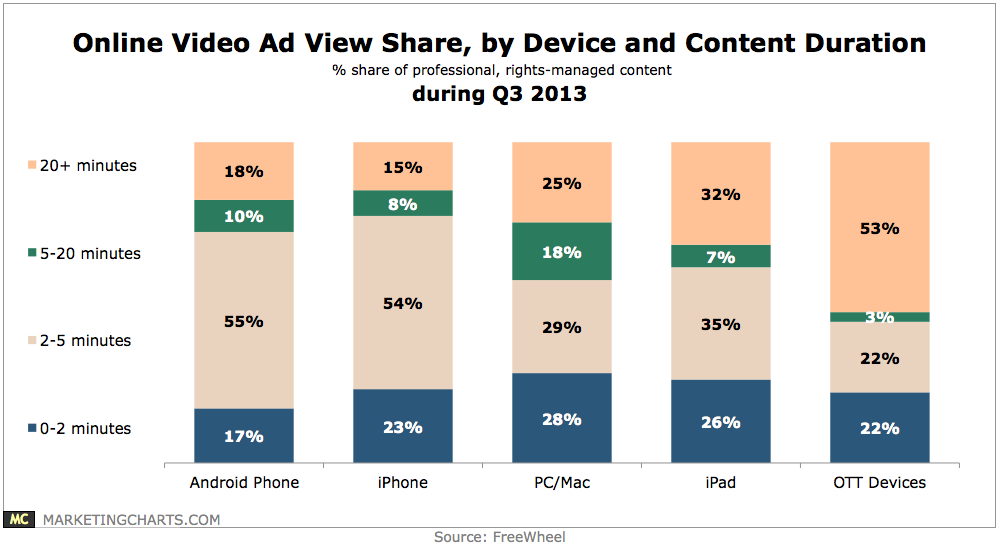
During Q3, 72% of ad views on Android phones were derived from content less than 5 minutes in length, with the corresponding figure at 77% for iPhone users.
Read MoreYouTube Net US Video Ad Revenues, 2011-2015 [CHART]
YouTube’s revenues from video ad formats will hit $1.22 billion next year, claiming a 21.1% share of all US video ad revenues.
Read MoreGlobal YouTube Net Ad Revenues, 2011-2013 [CHART]
After paying back advertising partners and video content creators, eMarketer still expects the company to net $1.96 billion in ad revenues worldwide this year, up 65.5% over 2012.
Read MoreGlobal YouTube Gross Ad Revenues, 2011-2013 [CHART]
YouTube will bring in about $5.60 billion in gross ad revenues this year.
Read MoreGlobal Social Media Ad Spending By Region, 2012-2015 [TABLE]
Social media ad spending will approach 12% in the US in 2014, and nearly 9% worldwide.
Read MoreLong-Form Video Ad Loads & Completion Rates, Q3 2012 – Q3 2013 [CHART]
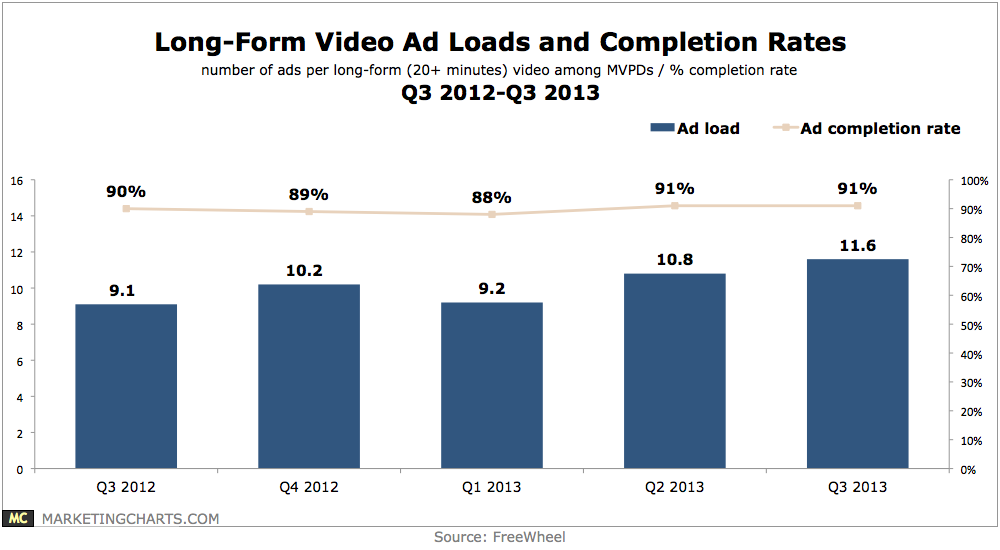
During Q3, FreeWheel says that the typical long-form (20+ minutes) video view carried 11.6 ads, up from 9.1 on average during the corresponding period last year.
Read MoreUS Outdoor Advertising Revenue Growth, Q2 2011 – Q3 2013 [CHART]
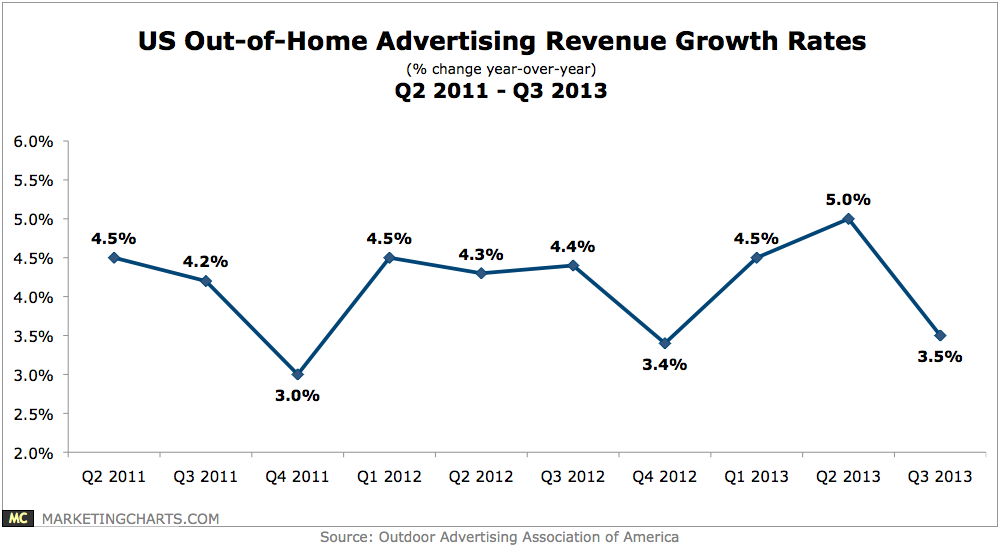
Outdoor ad revenues grew by 3.5% year-over-year during Q3, marking the 14th consecutive quarter of growth.
Read MoreSocial Shares Driven By Top 3 Viral Videos Ads, 2006-2013 [CHART]
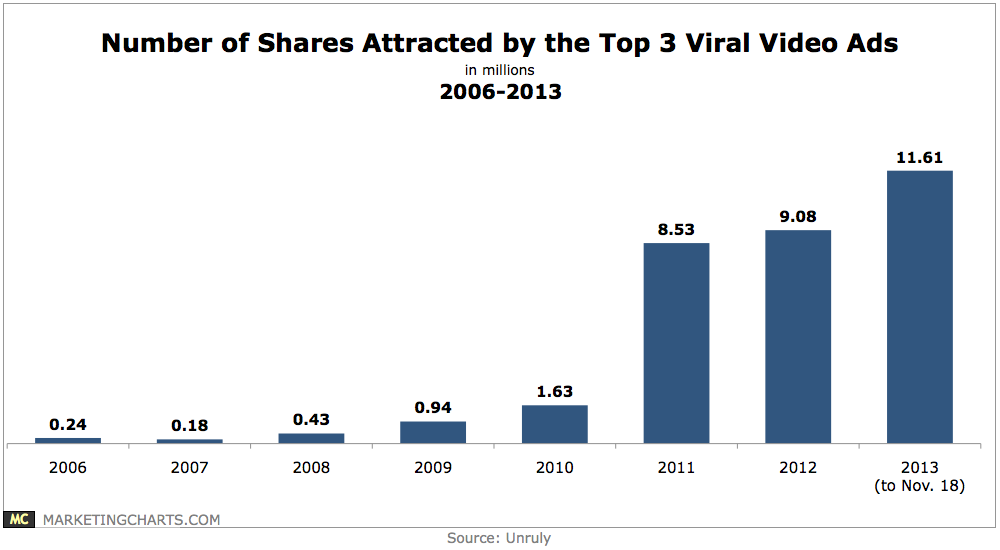
This year’s top 3 ads (through November 18) have generated 11.6 million shares, up from 1.6 million in 2010 and less than one-quarter of a million in 2006.
Read More