Advertising
Global Net Online Ad Revenue Share By Company, 2012 & 2013 [TABLE]
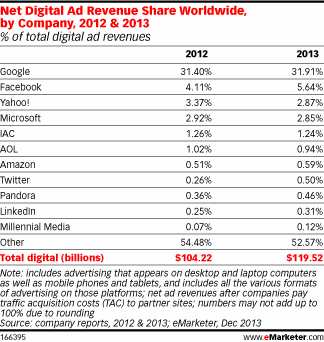
On a worldwide basis, Google and Facebook are also the top two ad publishers, with 31.91% and 5.64% of the market this year, respectively.
Read MoreNet US Online Ad Revenue Share By Company, 2012-2015 [TABLE]
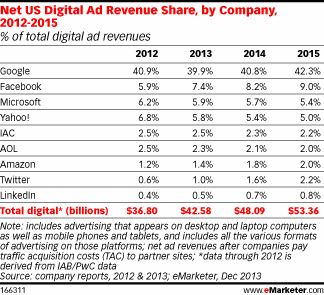
The rapid growth of mobile ad revenues at Facebook has helped make the social network the second-largest digital ad seller in the US, behind only Google.
Read MoreTop Ads On YouTube For 2013 [CHART]

Which brands managed to take the most advantage of the burgeoning online video advertising space this year?
Read MoreImportant Elements Of Retailers' Omnichannel Strategy, June 2013 [TABLE]
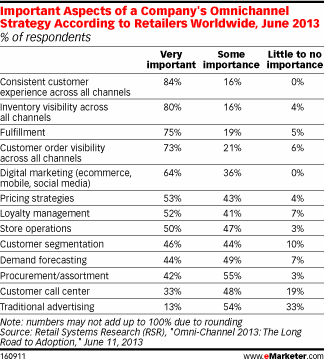
84% of retailers worldwide said that creating a consistent customer experience across channels was very important.
Read MoreMobile Ad Spending Growth By Vertical, Q3 2013 [CHART]
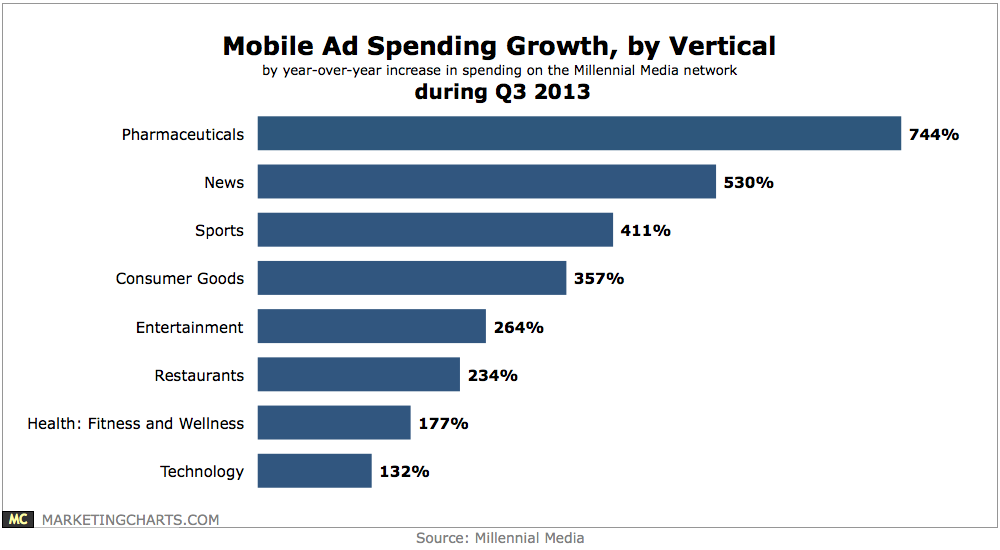
The pharmaceutical vertical leading the pack by virtue of an impressive 744% year-over-year increase in spending.
Read MoreHow Boomers Learn About New Video Games Or Gaming Hardware, 2013 [CHART]
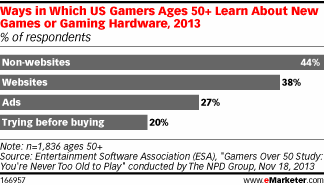
Older gamers are more likely to find out about new games and hardware through means other than the obvious digital channels.
Read MorePerformance Of CPG Mobile Ads By Distance To Store, Q3 2013 [CHART]
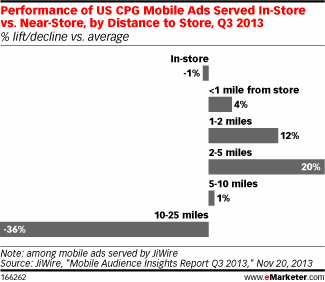
The performance of CPG ads targeted toward people near or in a store did best at middle distances, between 1 and 5 miles.
Read MorePerformance Of Auto Industry Geotargeted Mobile Video Ads By Distance To Dealer, Q2 2012-Q3 2013 [CHART]
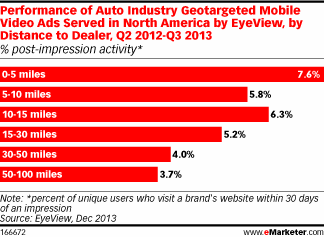
Geotargeted ads for dealers within 15 miles of the mobile device being served tended to do significantly better than those served to users farther away.
Read MoreUS Mobile Ad Spending Growth By Format, 2012-2017 [TABLE]
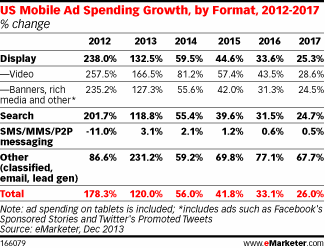
Virtually all the spending growth going to search, banners and rich media ad formats will go toward the mobile channel.
Read MoreUS Online Ad Spending By Channel, 2012-2017 [CHART]
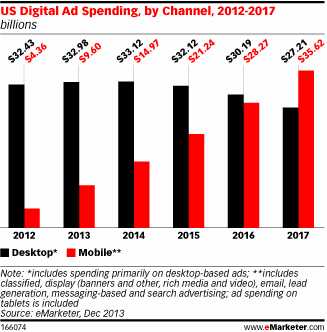
US digital ad spending, including paid media spending on ads appearing on all digital devices, will increase 15.72% this year to $42.58 billion.
Read More