Advertising
Americans' Views On Honesty & Ethics In Professions, December 2013 [CHART]
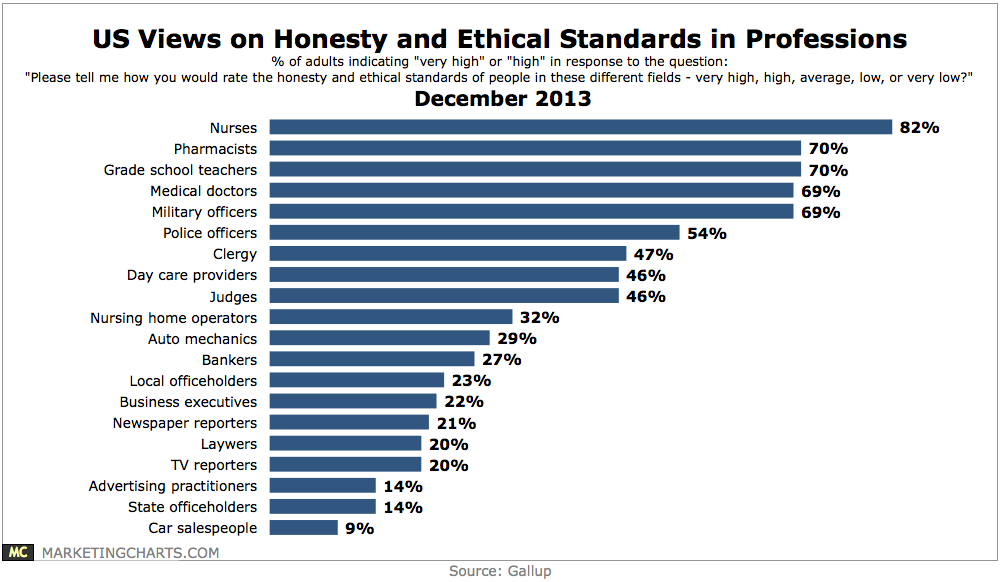
American adults have very little trust in the integrity of advertising practitioners.
Read MoreUS TV Ad Spending, 2011-2017 [CHART]
TV advertising expenditures are set to climb from $66.35 billion to $75.25 billion between 2013 and 2017.
Read MoreUS Total Media Ad Spending, 2011-2017 [CHART]
US total media ad spending will reach $171.33 billion in 2013, up 3.8%, or more than $6 billion, from 2012.
Read MoreUS Fraudulent Web Traffic, Q1-Q3 2013 [CHART]
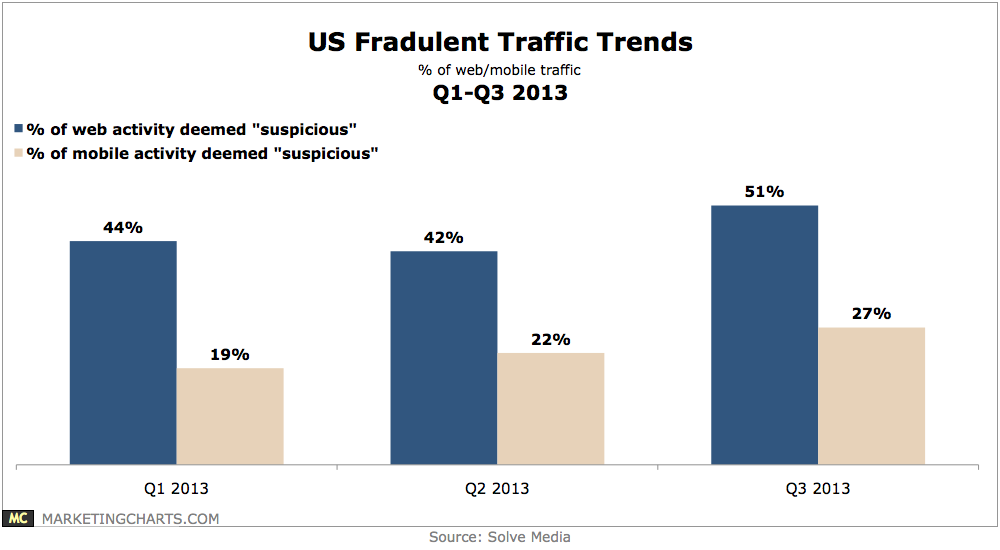
51% of web traffic in the US was deemed to be suspicious in Q3, representing a new high.
Read MoreUS Social Ad Revenue Forecast, Display vs Native 2012-2017 [CHART]
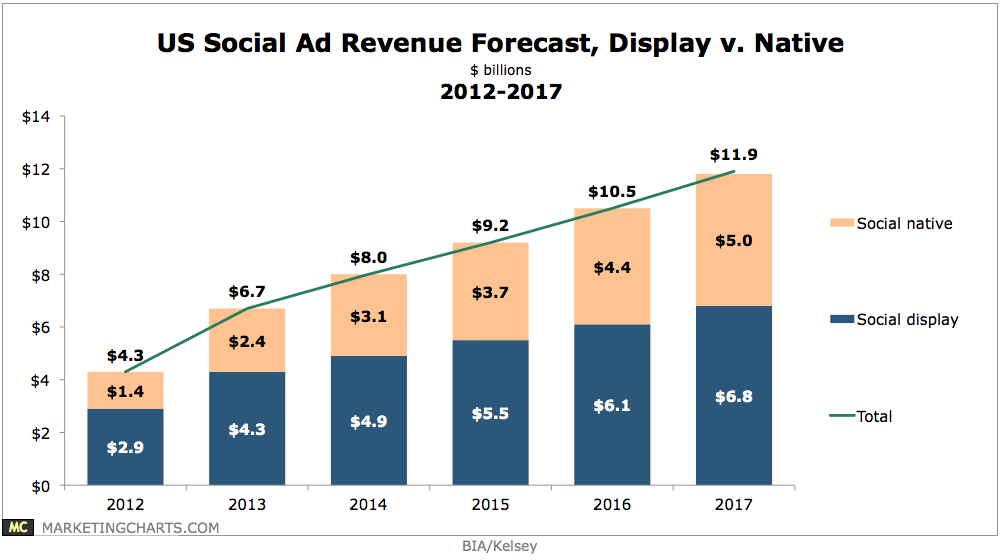
Native social ad revenues – primarily driven by Facebook’s Sponsored Stories and Twitter’s Promoted Tweets – will reach $5 billion in 2017, up from roughly $4.6 billion in the previous forecast.
Read MoreOnline Video Ad Views, December 2011-November 2013 [CHART]
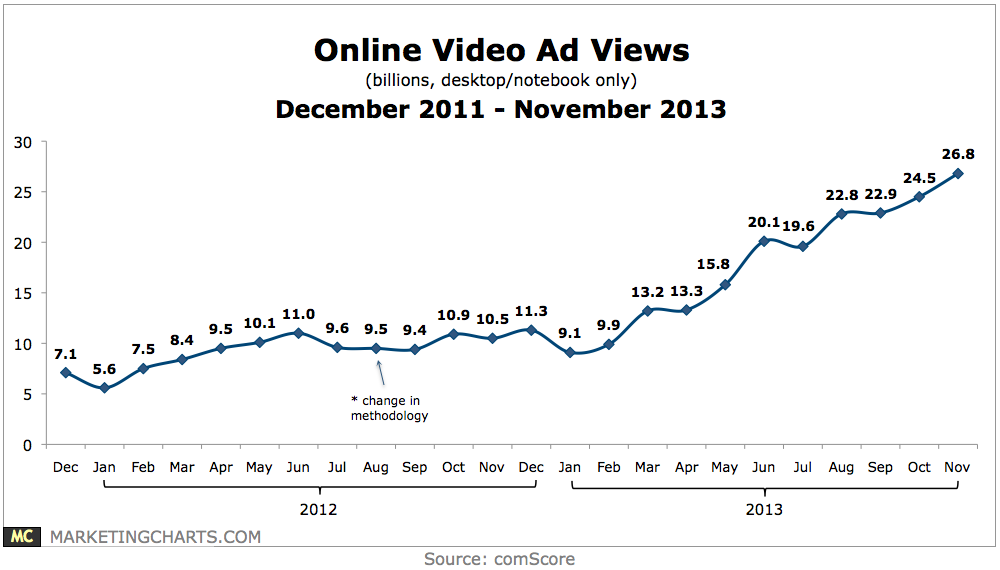
The number of online video ads Americans are watching from desktops and notebooks continues to rise on a monthly basis.
Read MoreChange In Ad Spend By Medium, Q3 2013 [CHART]
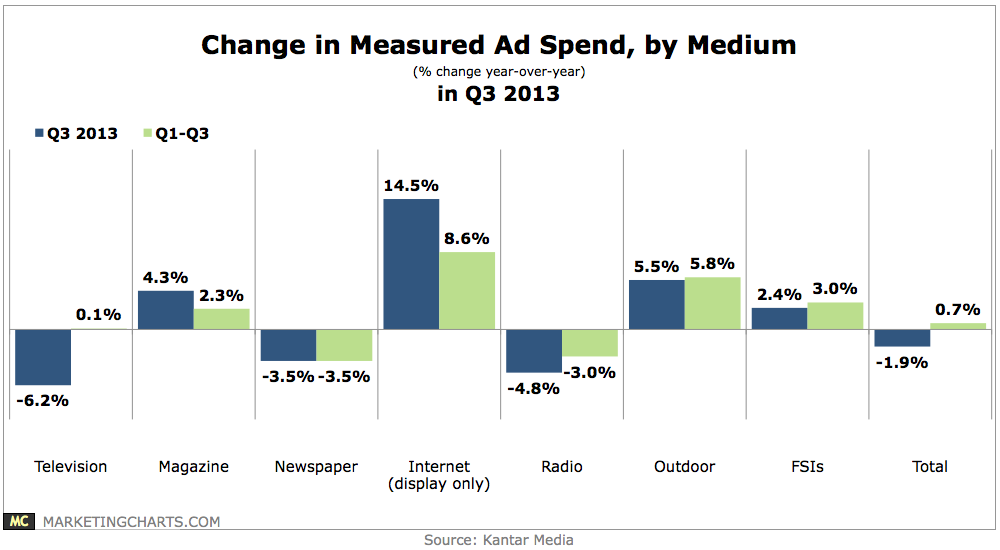
Total ad expenditures in Q3 were down 1.9% year-over-year, an unsurprising result given last year’s outlays on the Summer Olympics and political campaigns.
Read MoreChanges In Twitter Ad ROI, December 2013 [CHART]
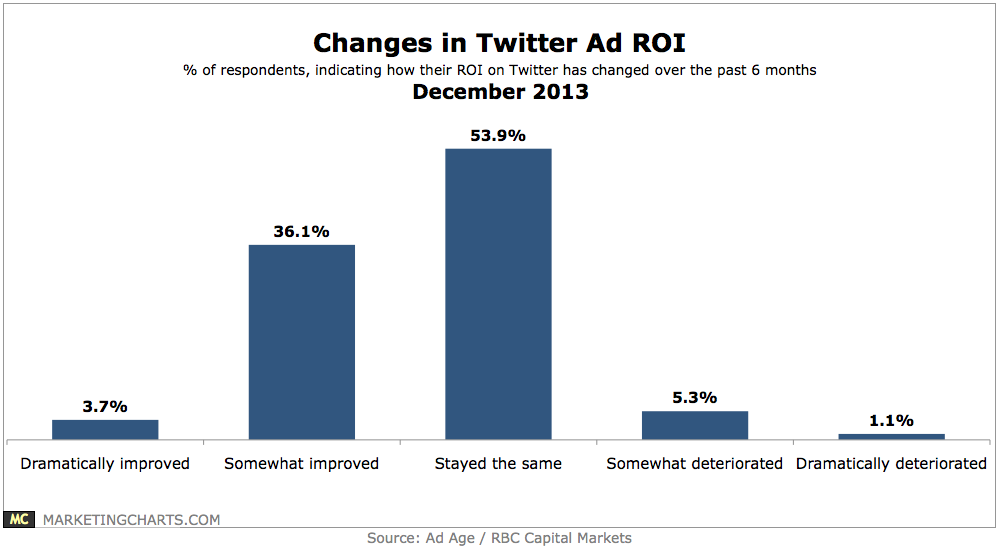
Roughly 6 in 10 marketers advertising on Twitter expect their Twitter ad budgets to increase either significantly (12.1%) or modestly (47.1%) over the next year.
Read MoreGlobal Net Mobile Ad Revenue Share By Company, 2012 & 2013 [TABLE]
Globally, Google dominates the mobile ad landscape, with a 48.76% market share.
Read MoreNet US Mobile Ad Revenue Share By Company, 2012-2015 [TABLE]

Google and Facebook grabbed the greatest shares of net US mobile ad revenues, with Facebook jumping from 9.0% to 16.0% between 2012 and 2013.
Read More