Advertising
Americans Attitudes Toward Super Bowl Ads By Gender, January 2014 [TABLE]
US adults will spend an average $68.27 on Super Bowl-related items.
Read MoreOnline Video Discovery Methods, January 2014 [CHART]
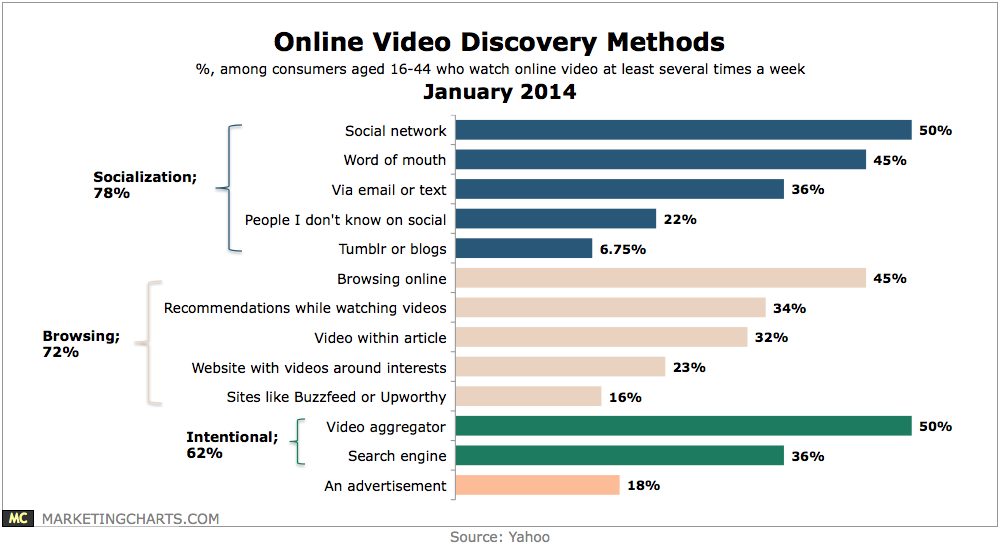
Almost 8 in 10 find videos through social means, with 50% finding them through their social network and 45% from word-of-mouth.
Read MoreFacebook Mobile Users & Ad Revenues, Q3 2012 – Q4 2013 [CHART]
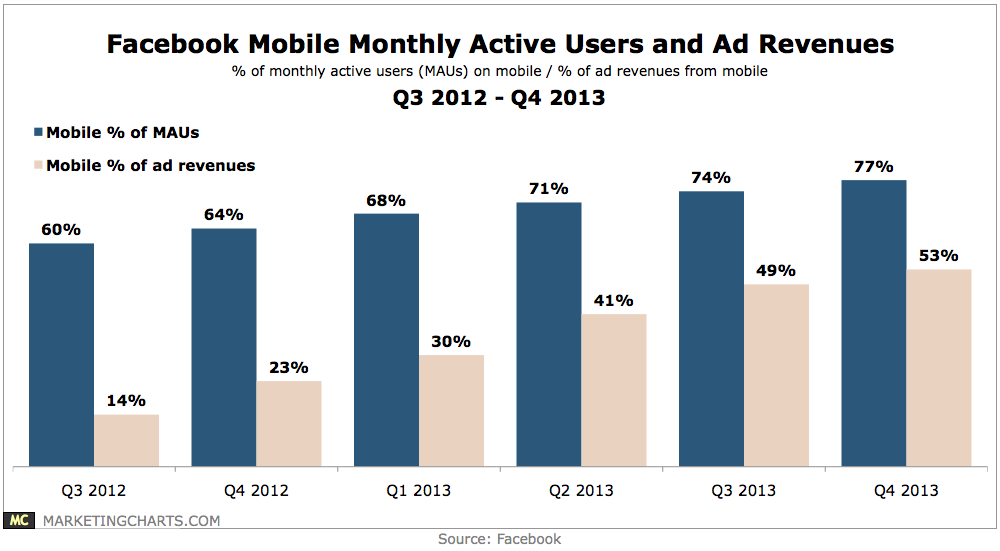
Facebook has crossed a threshold of sorts, with mobile now comprising a majority 53% share of its growing ad revenues.
Read MoreDisplay Ad Viewability Trends, H1 2012 – Q4 2013 [CHART]
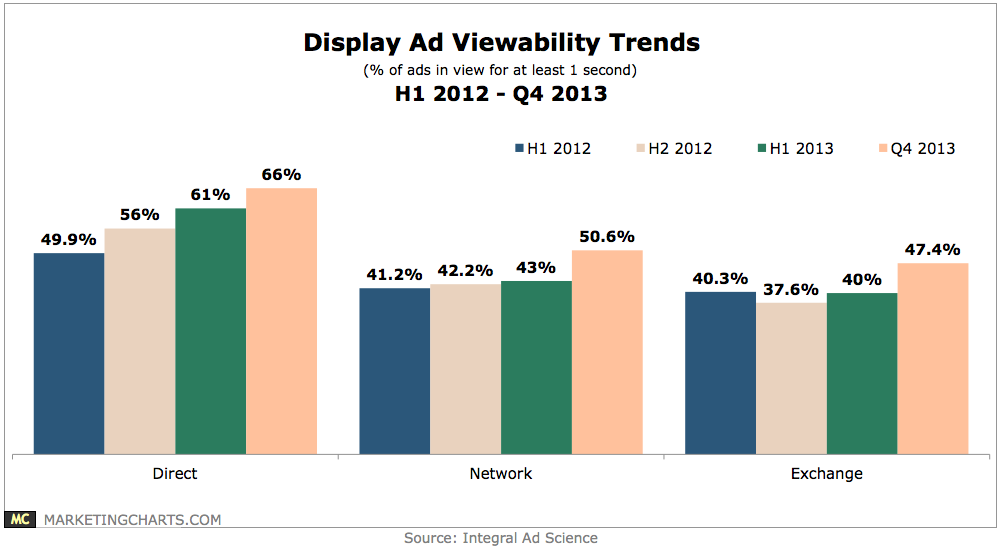
About 2 in 3 ads placed through direct publishers stayed in-view for at least 1 second during the fourth quarter of 2013, representing continued improvement from 61% in the first half (H1) of 2013, 56% in H2 2012 and 49.9% in H1 2012.
Read MoreGlobal Search Ad Spending Growth, Q4 2012-Q4 2013 [TABLE]
The growth rate for search ad spending in Asia-Pacific hit 28.58% in Q4 2013, making it the leader among all regions.
Read MoreGlobal Paid Search Metrics By Region, Q4 2013 [TABLE]
Clicks for paid search increased 12.3% year over year worldwide, although impressions had dropped by just over 10%.
Read MoreSocial TV & Super Bowl Ads [INFOGRAPHIC]
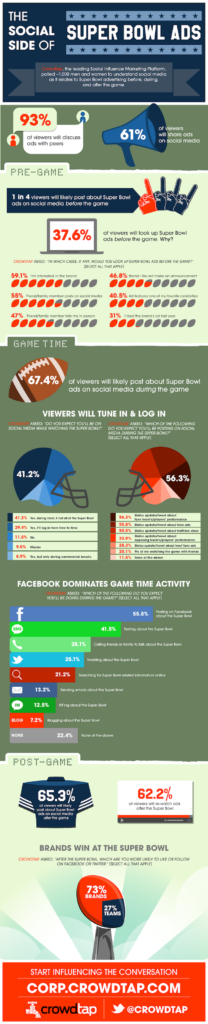
This infographic from Crowdtap illustrates the social side of Super Bowl ads.
Read MoreAppeal Of Online Video Ad Types, January 2014 [CHART]
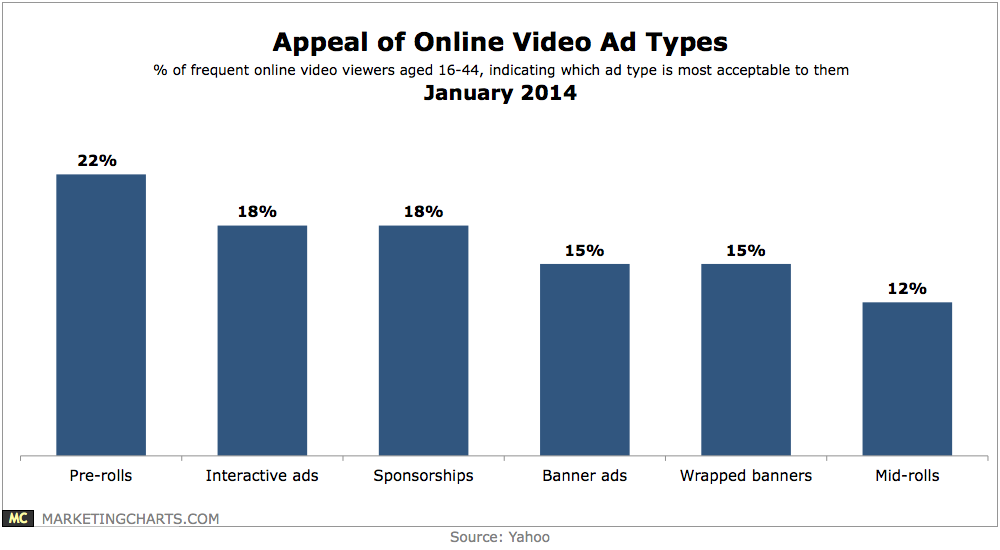
Across 6 ad types listed, pre-rolls emerged as the most acceptable type of ad, cited by 22% of respondents.
Read MoreBot Traffic Problems, January 2014 [TABLE]
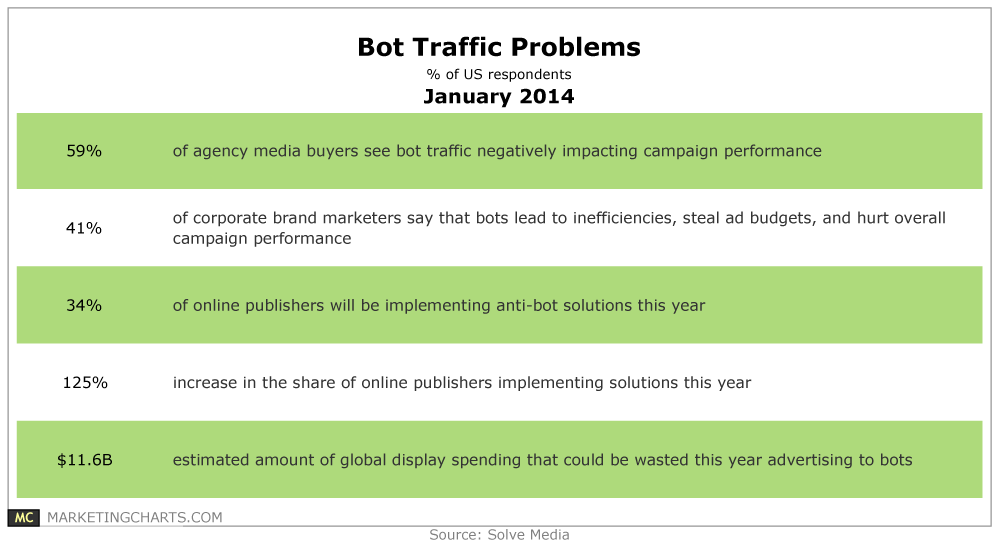
59% of agency media buyers see bot traffic’s harmful effects on campaign performance.
Read MoreAffluent Super Bowl Audiences, 2003-2013 [CHART]

The Super Bowl audience has numbered more than 50 million TV homes over each of the past 4 big games.
Read More