Advertising
Video Completion Rates Of Rich Media Ads By Type & Size, 2013 [TABLE]
Clickthrough rates for rising stars were 70% higher than for standard placements, and video completion rates experienced a 19% lift.
Read MoreUS Online Ad Revenues, 2004-2013 [CHART]
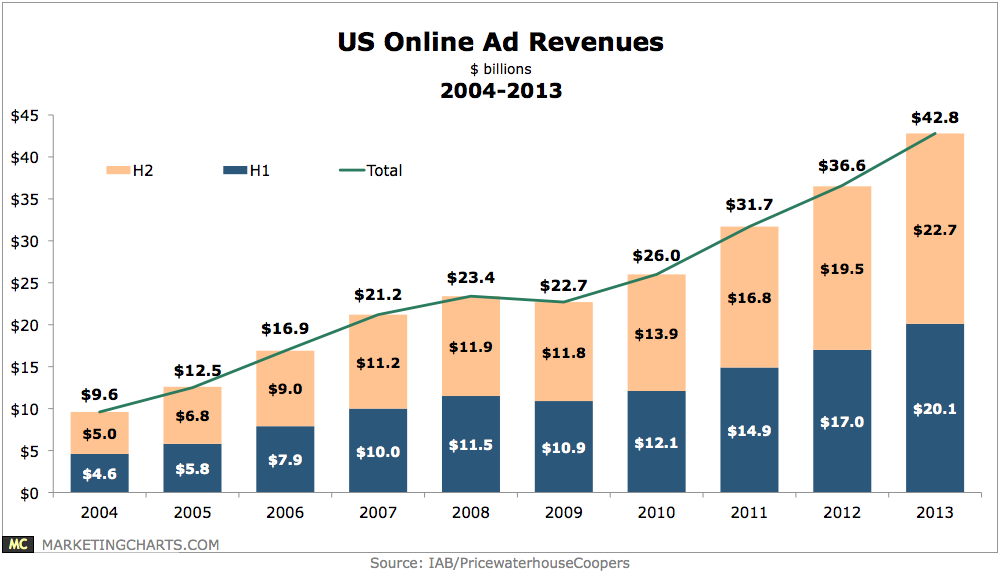
Online advertising set yet another peak in Q4 2013, growing by 17.5% to reach $12.1 billion, the largest quarter on record.
Read MoreTop Marketing Tactics Used By US Small Businesses, March 2014 [CHART]
Friend referrals were the marketing tool US small businesses saw the most success with, with more than half of respondents saying so.
Read MoreTop Purchase Influences Among UK Students, 2013 [CHART]
Price was the biggest purchase driver by far, cited by nearly half of UK students.
Read MoreConsumer Attitudes Toward Local Search, April 2014 [TABLE]
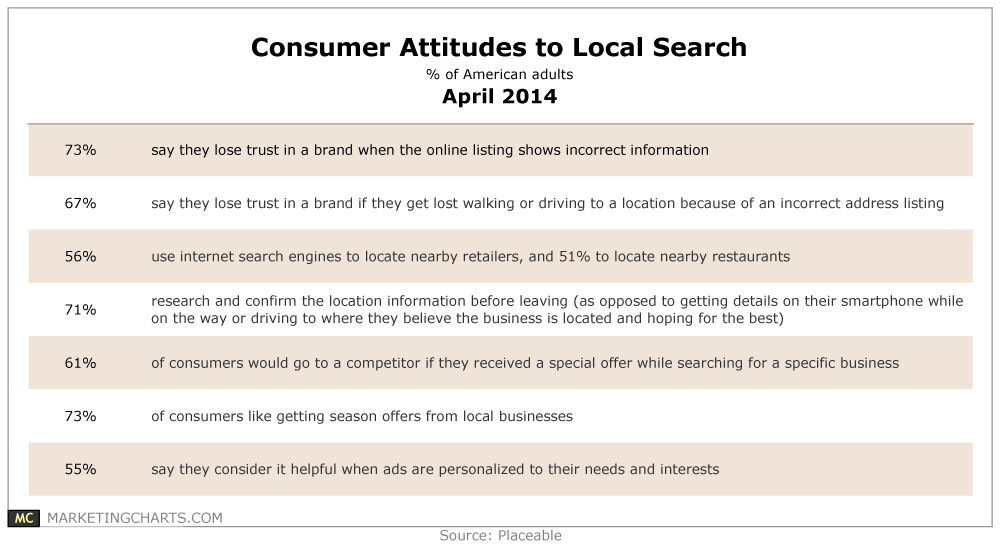
Some 73% of consumers surveyed said they lose trust in a brand when the online listing shows incorrect information.
Read MoreRich Media Ad Benchmarks By Vertical, 2013 [TABLE]
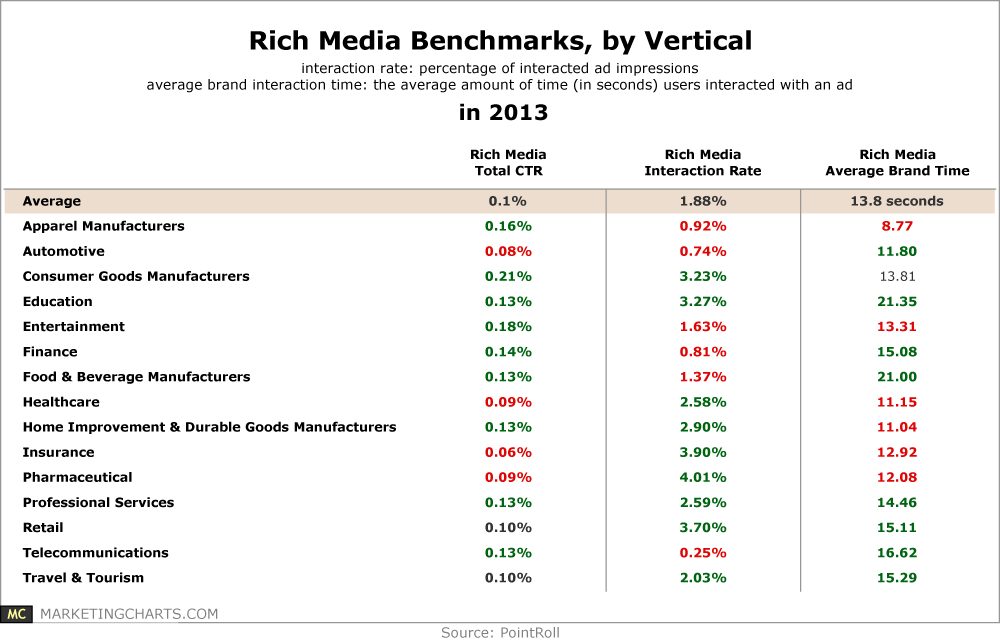
Rich media click-through and interaction rates were higher when including video.
Read MoreOnline Video Ad Views, December 2011 – February 2014 [CHART]
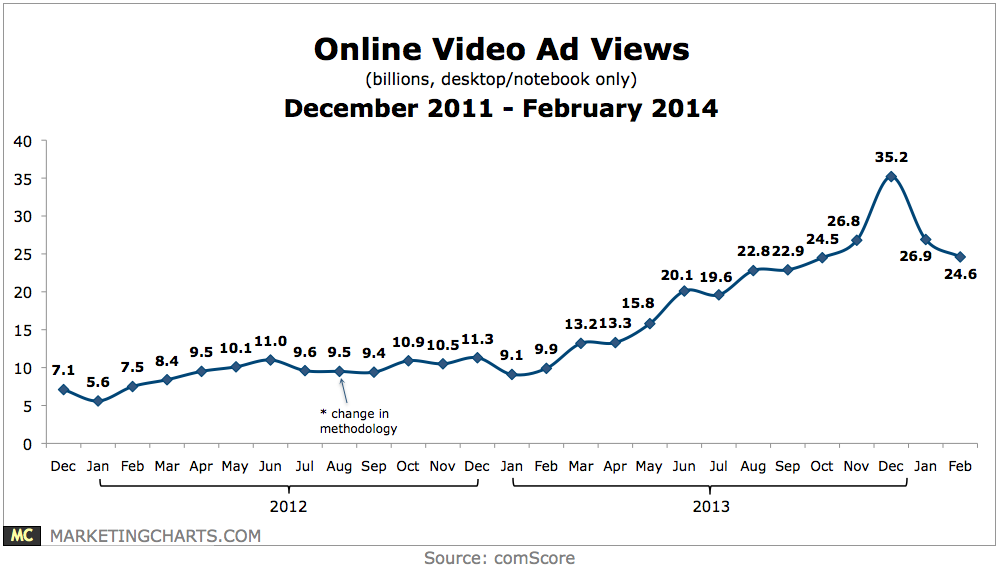
Despite online video ad views (desktop/notebook only) falling during the first couple of months of the year, the February total (24.6 billion) remains significantly above the year-earlier period (9.9 billion).
Read MoreTop Advantages Of Video Ads, September 2013 [TABLE]
Among brand advertisers in North America, digital video’s ability to target specific consumers was one of its greatest advantages.
Read MoreUS Online Video Advertising Share By Industry, Q4 2013 [CHART]
Video advertising platform Videology reported that its consumer goods clients in the US were ahead of other verticals in Q4 2013 in serving digital video ads.
Read MoreLocal Ad Spending Forecast, 2013-2018 [CHART]
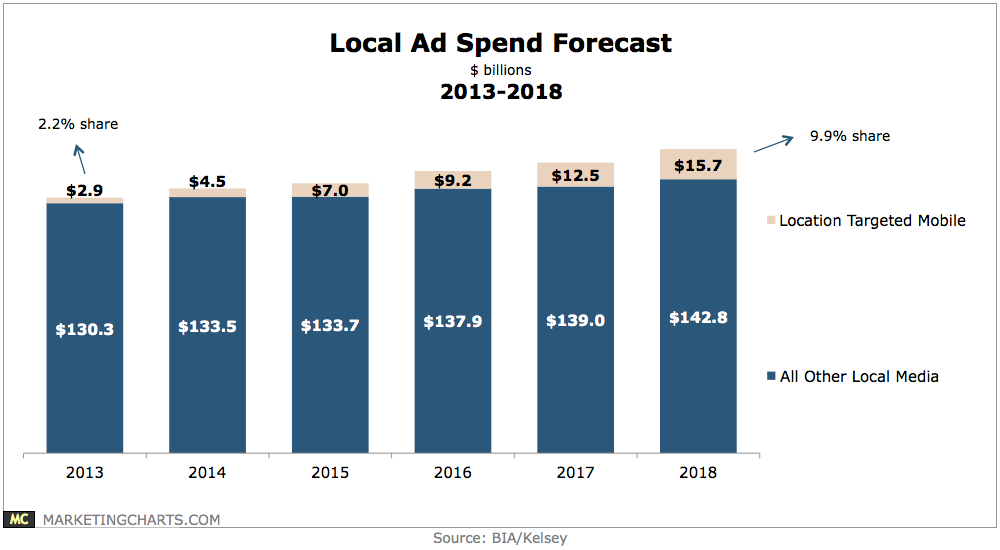
US mobile ad spend is projected to grow from $7.2 billion last year to $30.3 billion in 2018, with a slight majority 52% – or $15.7 billion – of that eventual figure being location-targeted spending.
Read More