Advertising
Facebook Ad KPIs By Demographic, Q1 2014 [CHART]
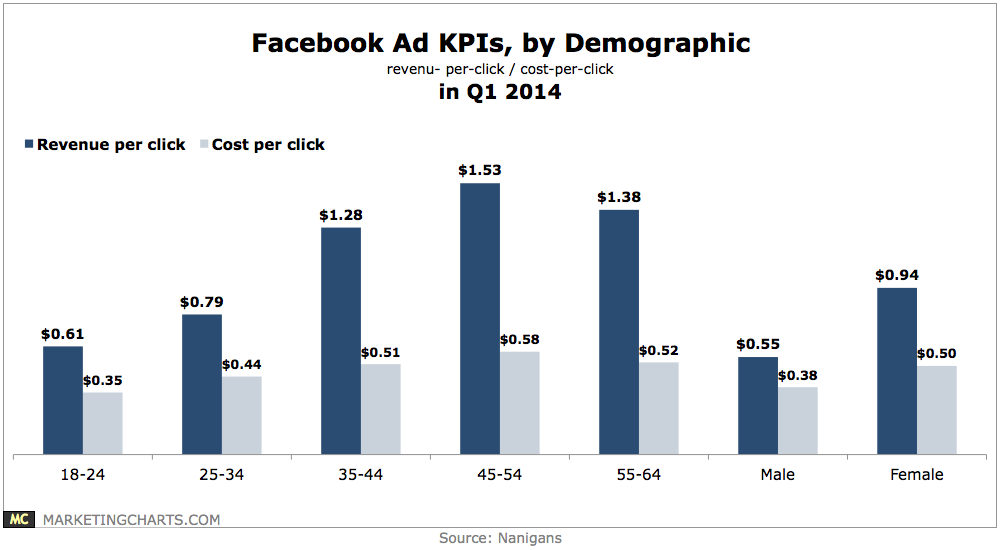
Roughly one-quarter of ad spending aimed at Facebook users aged 18-64 was directed to the 18-24 bracket in Q1.
Read MoreOnline Video Ad Views, December 2011 – March 2014 [CHART]
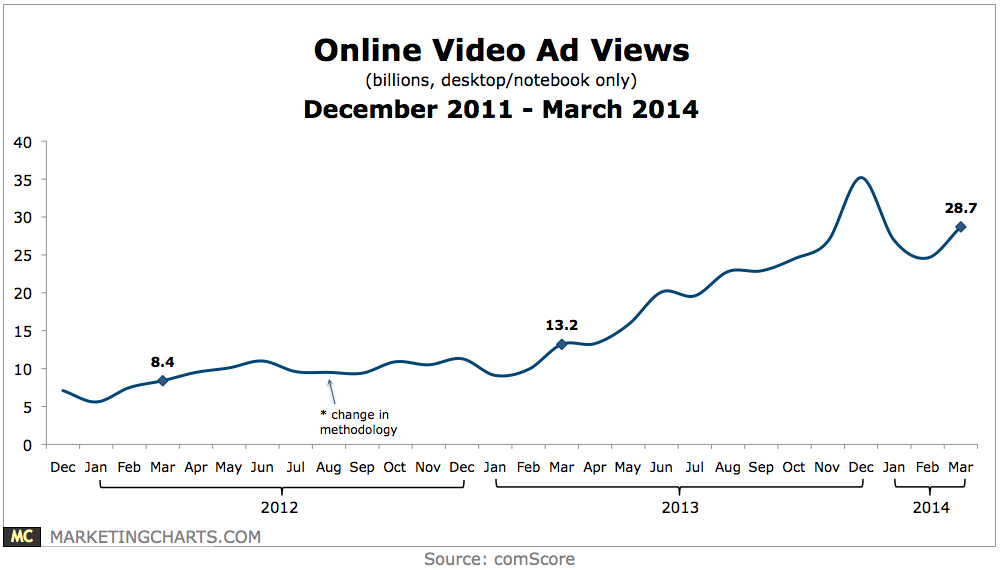
Online video ad views (desktops and notebooks only) grew to 28.7 billion in March, more than double the year-earlier period (13.2 billion).
Read MoreOnline Display Ad Benchmarks By Region in 2013 [CHART]
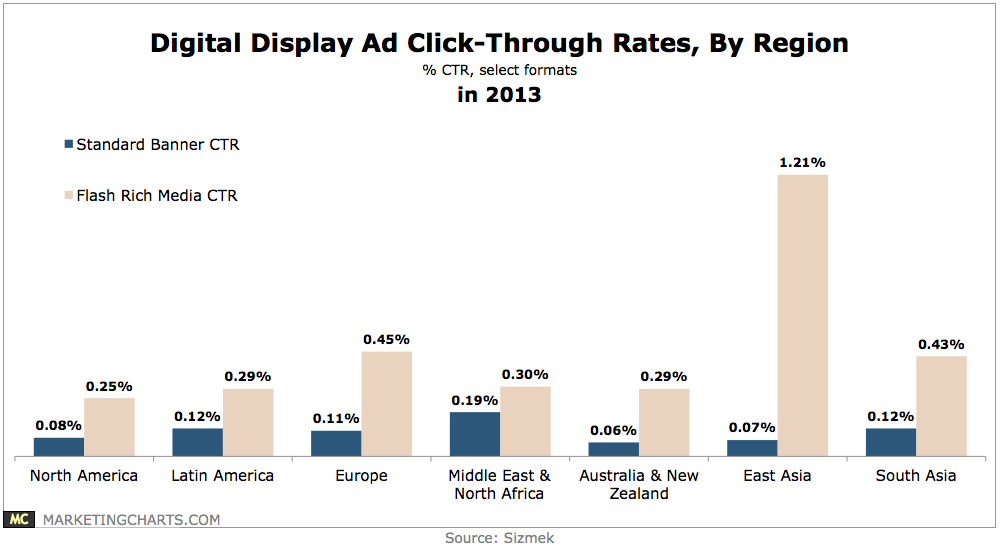
In North America, the average click-through rate (CTR) for standard banners slipped from 0.1% to 0.08%, while flash rich media CTRs jumped from 0.14% to 0.25%.
Read MoreSearch Advertising Trends, Q1 2014 [TABLE]
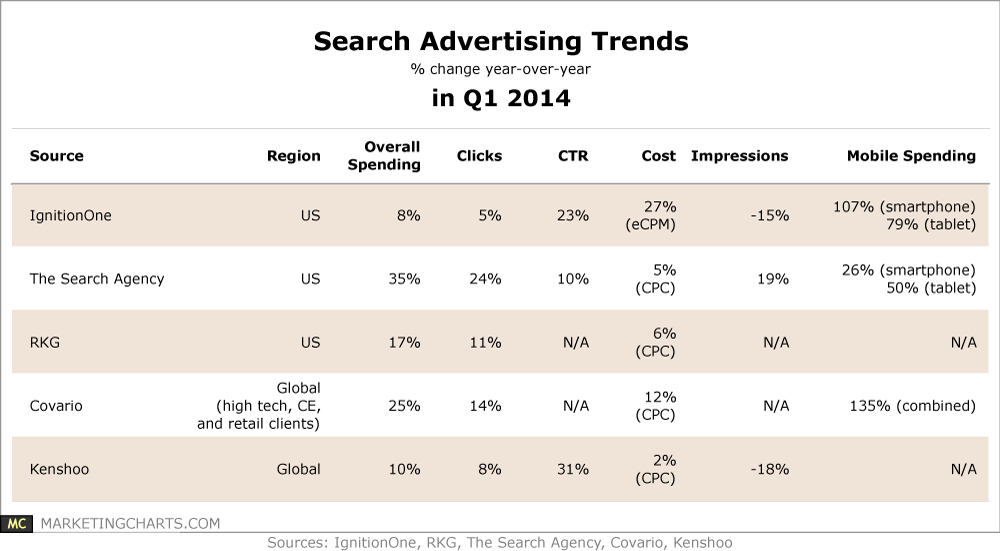
Spending is up (particularly on mobile), as are click-through rates.
Read MoreB2B Media Industry Revenues, 2008-2013 [CHART]
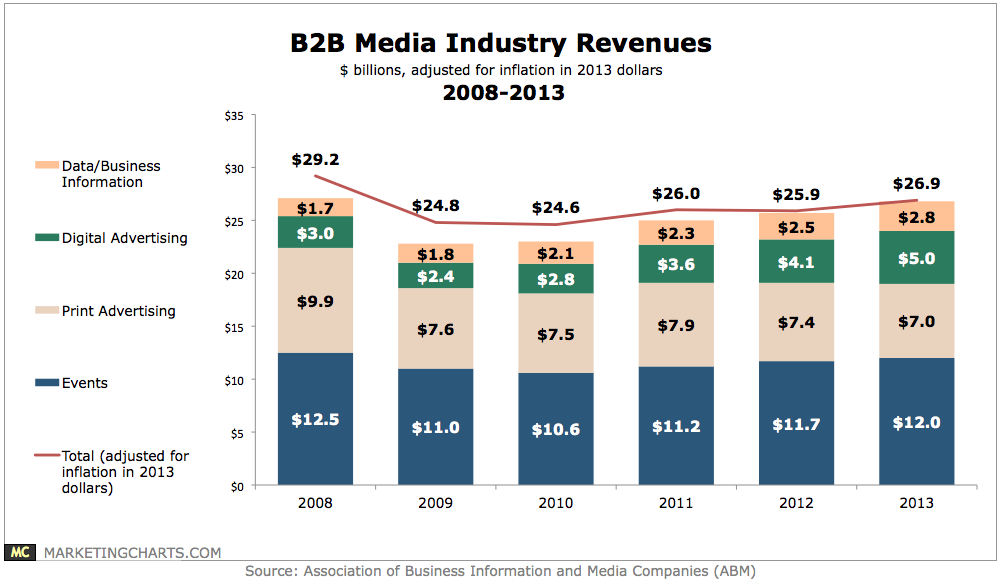
Industry revenues grew by 4.8% year-over-year (3.8% when adjusted for inflation) to reach $26.9 billion, the highest total since 2008 ($29.2 billion, adjusted for inflation in 2013 dollars).
Read MoreItalian Mobile Social Media Activities, November 2013 [CHART]
eMarketer estimates that 41.8% of the Italian population will have a smartphone in 2014—well below the regional average of 47.0%—and a similar gap will persist through 2017.
Read MoreGoogle+ Is NOT Dead & Video Meets Commerce [VIDEO]

David Erickson & BL Ochman discuss rumors of Google+’s imminent demise, touchable videos, the NYPD’s Twitter storm and more on the Beyond Social Media Show.
Read MoreUS Mobile Local Ad Spending By Format, 2013-2018 [TABLE]
Search and social were among the top among formats, with search claiming the majority of location-targeted mobile ad spending through 2018.
Read MoreUS Local vs. National Mobile Ad Spending, 2013-2018 [CHART]
Berg Insight predicted that ad revenues from social networking and local search would drive mobile local ad spending.
Read MoreUS Paid Search Ad Spending Growth, Q1 2013 – Q1 2014 [CHART]
65% of marketers were using data collected from PLAs to better inform other paid search and cross-channel strategies.
Read More