Advertising
Global Mobile In-App Ad Spending, 2013 & 2018 [CHART]
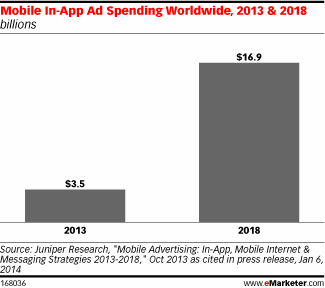
In January 2014, it predicted that mobile in-app ad spending worldwide would explode from $3.5 billion in 2013 to $16.9 billion by 2018.
Read MoreEngagement & Impact Of Mobile Ads In UK, January 2014 [TABLE]
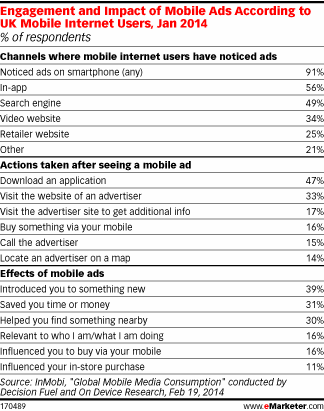
Because UK mobile internet users spend so much time with apps, it comes as no surprise to learn that in-app ads are the most commonly seen.
Read MoreUS Local Ad Spending – National vs Local Advertisers, 2013-2018 [TABLE]
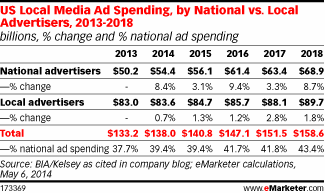
National advertisers will up US local media ad spending by 8.4% in 2014, from $50.2 billion in 2013 to $54.4 billion—or nearly 40% of all local media ad investments.
Read MoreUS Social Ad Revenues – Desktop vs Mobile, 2013-2018 [CHART]
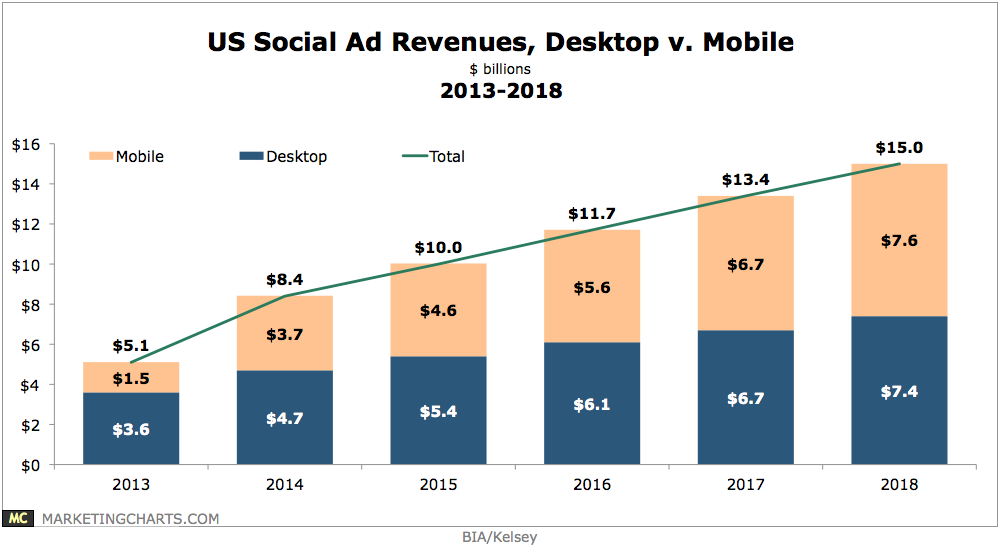
Social mobile ad revenues in the US exceeded $1.5 billion last year, and will grow at a rapid 38.3% compound annual rate through 2018, when they will reach $7.6 billion.
Read MoreUS Social Ad Revenues – Display vs Native, 2013-2018 [CHART]
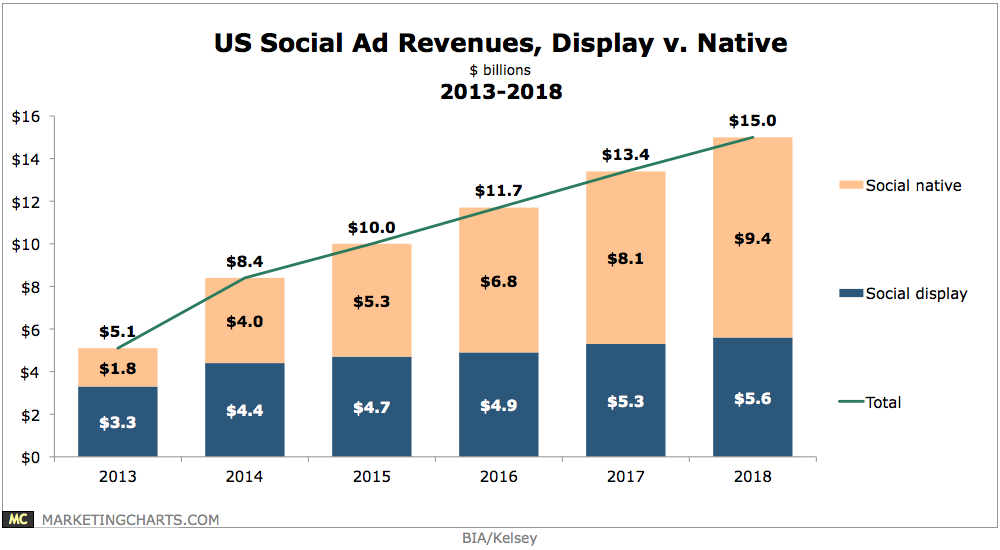
Native social ads are expected to overtake social display ads in revenue next year.
Read MoreTop Mobile Marketing Metrics, May 2014 [CHART]
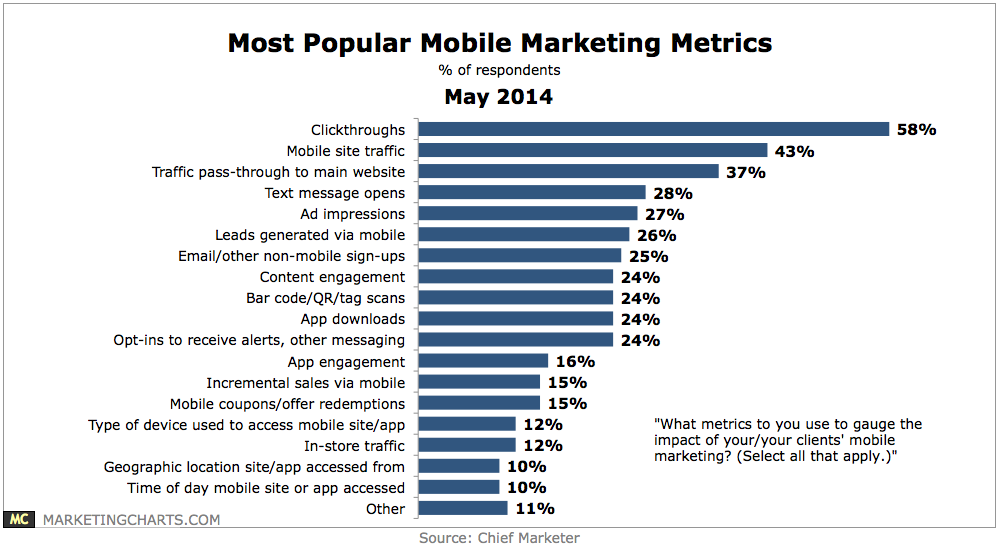
While only 31% of marketers and agencies ran campaigns or promotions directed at mobile users last year, a slight majority 52% plan to run campaigns specific to mobile users this year.
Read MoreUnderstanding & Use Of Programmatic Buying Among Marketers, March 2014 [CHART]

Nearly one-quarter of US client-side marketers understood programmatic buying and had run campaigns on this basis.
Read MoreUS Premium Programmatic Ad Spending By Channel, 2013-2017 [TABLE]
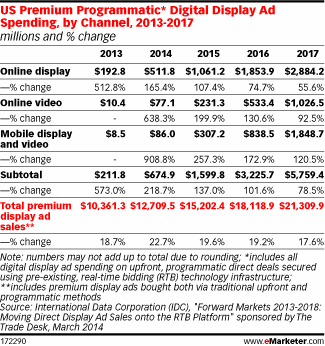
Spending on premium programmatic online display advertising will rise 165.4% in the US this year.
Read MoreTop Genres By TV Ad Spend, 2013 [CHART]
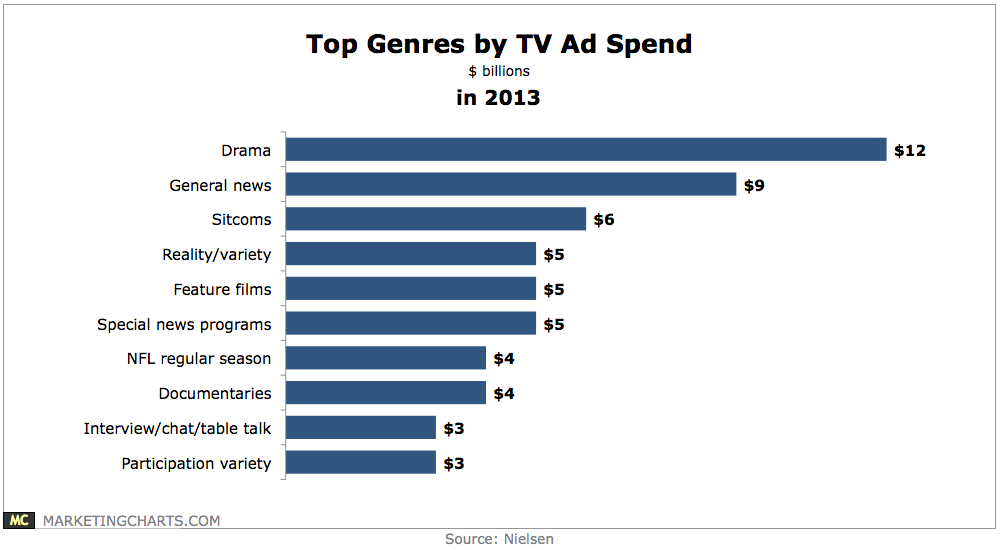
Drama ($12 billion in ad spend) netted the biggest share of the $78 billion TV ad spending pie last year, at more than 15%.
Read MoreTop Online Marketing Channels That Generated Orders, Q1 2013 & Q1 2014 [TABLE]
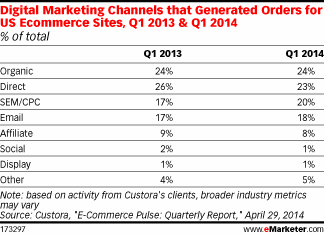
Social accounts for just 1% of US eCommerce orders in Q1 2014, tying display for the lowest share.
Read More