Advertising
TV Commercial Viewing Frequency, July 2014 [CHART]
TV multitasking is on the increase, and some 82% of US adults at least occasionally go online while watching TV.
Read MoreNet US Online Ad Revenue Share By Company, 2012-2016 [TABLE]
Google alone already accounts for more than 10% of all advertising spending in the US.
Read MoreUS Online Ad Spending By Channel, 2012-2018 [TABLE]
Strong, steady growth in mobile advertising will push digital ads to represent nearly 30% of all US ad spending this year.
Read MoreTotal US Ad Spending Share By Media, 2012-2018 [TABLE]
US adults will spend an average of 2 hours 51 minutes per day with mobile devices this year.
Read MoreTotal US Ad Spending, 2012-2018 [CHART]
Total ad investments will jump 5.3% to reach $180.12 billion, achieving 5% growth for the first time since 2004, when ad spending increased 6.7%.
Read MoreTypes Of Content Brands Develop For Social Media [CHART]
Posts and videos are the most widely used types of content on social, as 96% and 89% of brands have produced them, respectively.
Read MoreMobile Advertisers’ Campaign Goals, Q1 2014 [CHART]

A plurality 34% of mobile campaigns on the Millennial Media network counted site/mobile traffic as their goal, with brand awareness and engagement (23%) the second-most popular goal.
Read MoreTolerance Toward In-App Marketing In Exchange For Free App, January 2014 [CHART]
Though 63% of US smartphone app users said they knew mobile ads were necessary, they were far more likely to prefer rewards: 84%.
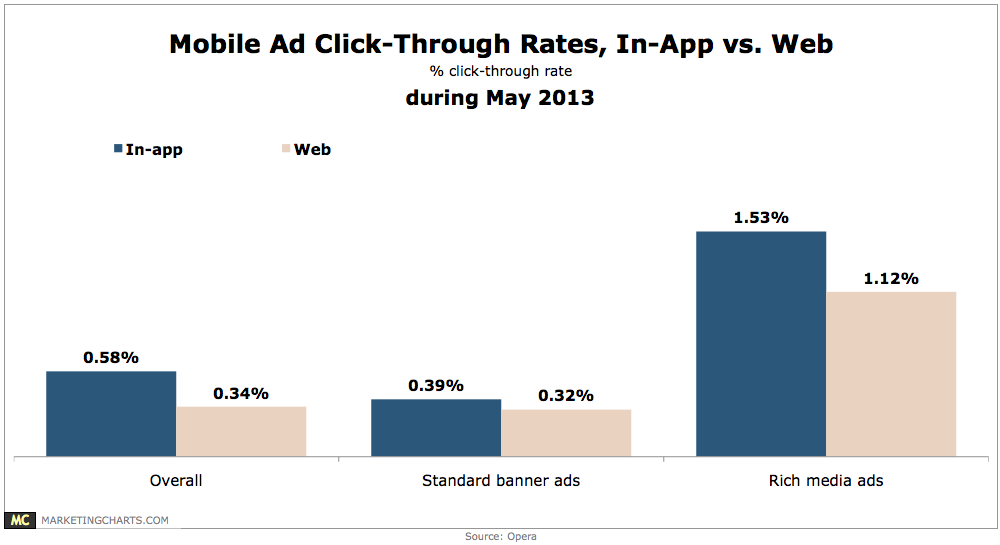
Read MoreMobile In-App Ad Preferences, March 2014 [CHART]
More than two-thirds of US smartphone owners surveyed said that if they had to see in-app advertising, being offered a reward for viewing or engaging with an ad was their top preference.
Read MoreAverage US Display CPMs, Q1 2012-Q1 2014 [CHART]
The average CPM of US desktop display ads purchased directly from publishers or ad networks has moved in a tight range in the past couple years.
Read More