Advertising
Digital Ad Revenues By Company [CHART]
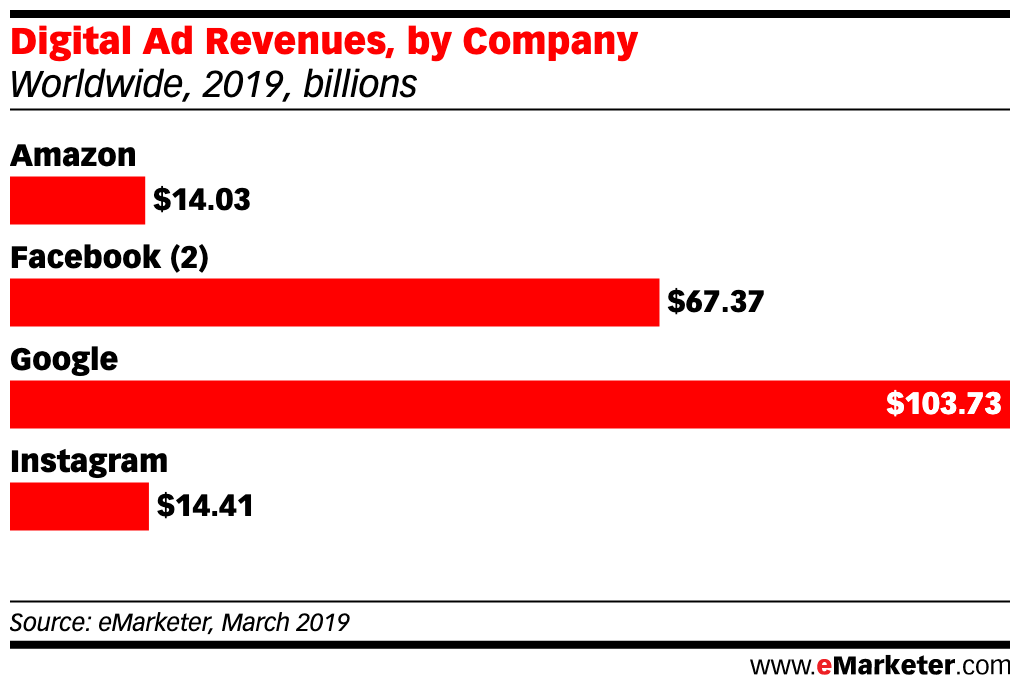
Facebook released better-than-expected results on July 24, reporting $16.9 billion in revenues, 1.59 billion in daily active users (DAUs), and $7.05 in average revenue per user (ARPU). This came just as the company was fined a record-setting $5 billion by the Federal Trade Commission (FTC) as a result of the 2018 Cambridge Analytica scandal.
Read MoreAd Blocking User Growth, 2018-2021 [CHART]
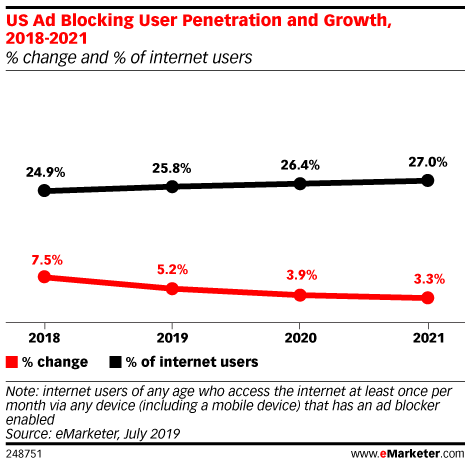
Fewer internet users than expected are blocking ads across the US and Western Europe. For the second year in a row, eMarketer downgraded their estimates of the ad blocking population in France, Germany, the UK and US, as well as their forecast for future growth.
Read MoreMillennials' Changing Relationships With Businesses [CHART]
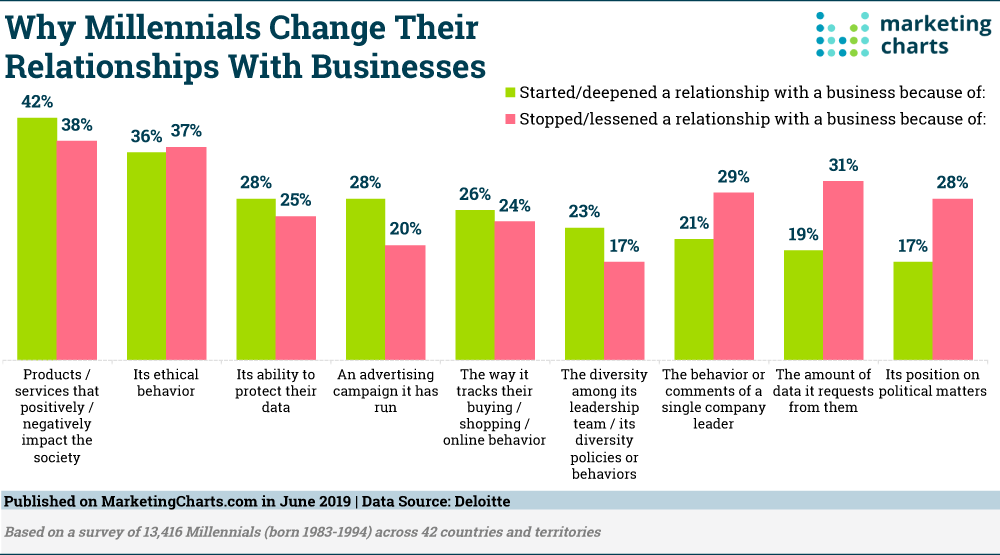
Millennials spend about $322.5 billion annually, a strong figure but one that’s less than Baby Boomers and Gen Xers. What may set Millennials apart from those other two cohorts is that they are more apt to let their purchasing dollars speak for them when it comes to a business’ environmental impact or ethical behavior, according to this year’s Global Millennial Survey from Deloitte.
Read MorePolitical Ad Spending By Media, 2020 [CHART]
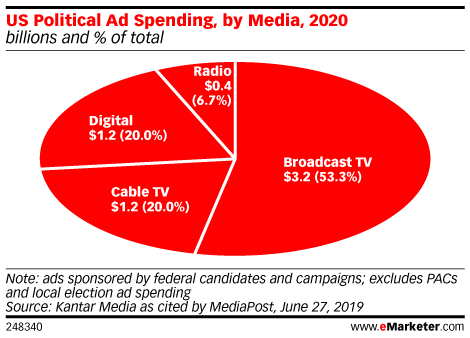
Of the $6 billion in political campaign spending this cycle, Kantar expects 20%, or $1.2 billion, to go to digital. TV still wins the lion’s share of campaign budgets, with almost three-quarters of the total split between broadcast and cable TV.
Read MorePolitical Ad Spending, 2014-2020 [CHART]
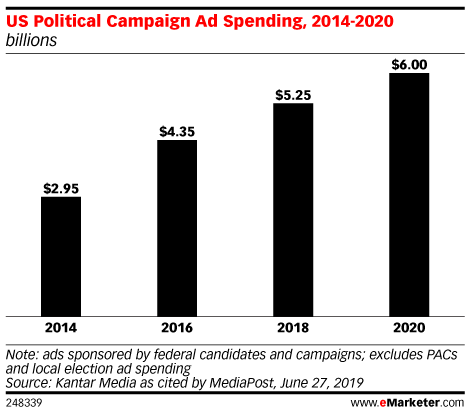
Growth in political ad spending is expected to slow dramatically during the 2019-2020 election cycle, according to Kantar Media, which predicts political campaigns for US federal office will spend $6 billion on paid media placements this year. But a greater share than ever will be directed toward digital channels.
Read MoreTop D2C Customer Acquisition Channels [CHART]
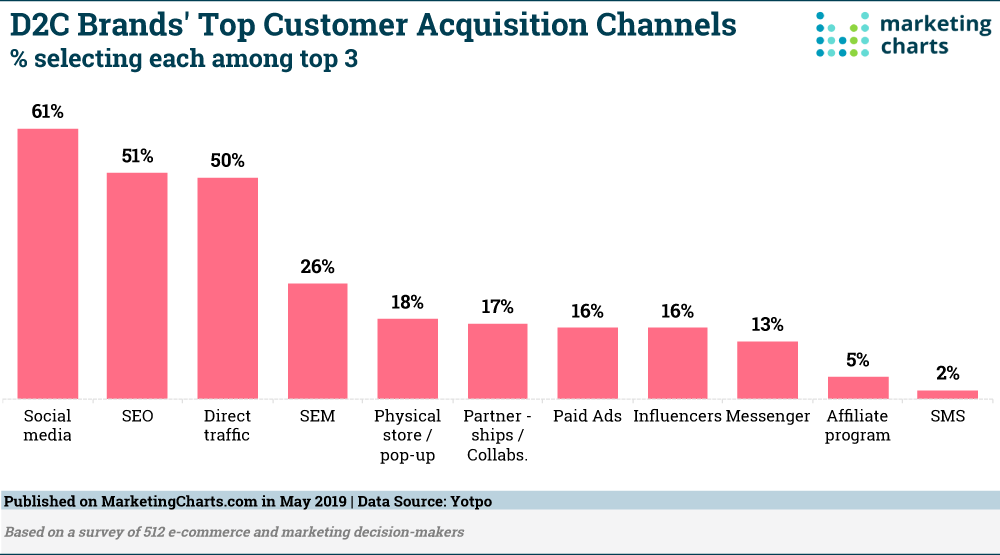
With many retailers having concerns about selling on marketplaces – ranging from having to share a cut of revenues to potential customer relationship issues – some are choosing to cut out the middle-man and sell to customers directly.
Read MoreAttitudes Toward Regareting Ads By Age [CHART]
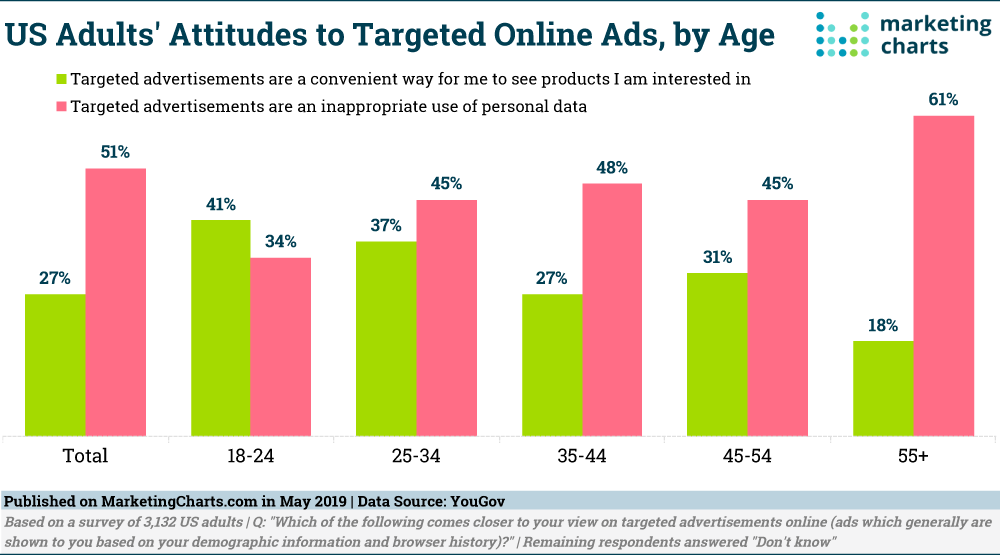
Generally, Americans have an unfavorable opinion about online targeted advertising. More than half (51%) of US adults believe that targeted advertisements are an inappropriate use of personal data rather than a convenient way to see products they’re interested in, according to more than 3,100 US adults surveyed by YouGov.
Read More15 Essential Digital Marketing Tools [INFOGRAPHIC]
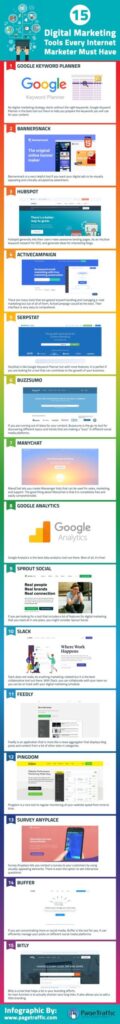
This infographic from PageTraffic illustrates fifteen digital marketing tools such as Google Keyword Planner, HubSpot, BuzzSumo, Sprout Social and Google Analytics.
Read MoreInfluencer Marketing Rates [TABLE]
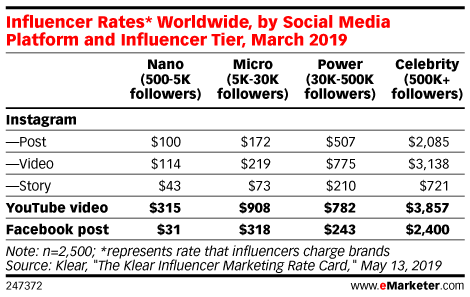
According to a January 2019 survey by influencer marketing service Mediakix, more than one-third of US marketers said the rising cost of influencers was a leading marketing challenge in this space.
Read MoreUS Podcast Revenues, 2015-2021 [CHART]
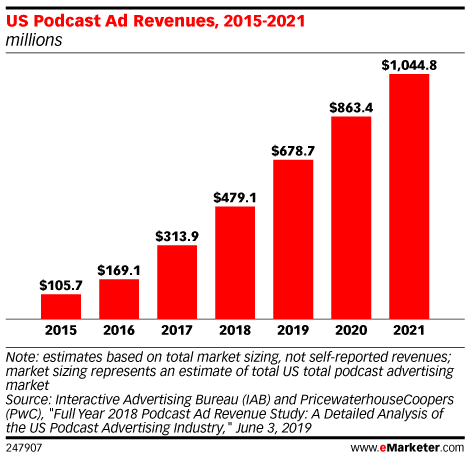
The podcasting industry continues to explode with potential for advertisers, and the numbers show it: Marketers spent $479 million on podcast ads in 2018, and podcast advertising revenues are projected to surpass $1 billion by 2021, according to figures from the Interactive Advertising Bureau (IAB) and PwC.
Read More