Advertising
Mobile Web vs In-App Add Performance Metrics, Q3 2014 [CHART]
Mobile users are far more likely to click on ads served in an app than via mobile browser.
Read MoreTop TV Advertisers of 2014 [TABLE]
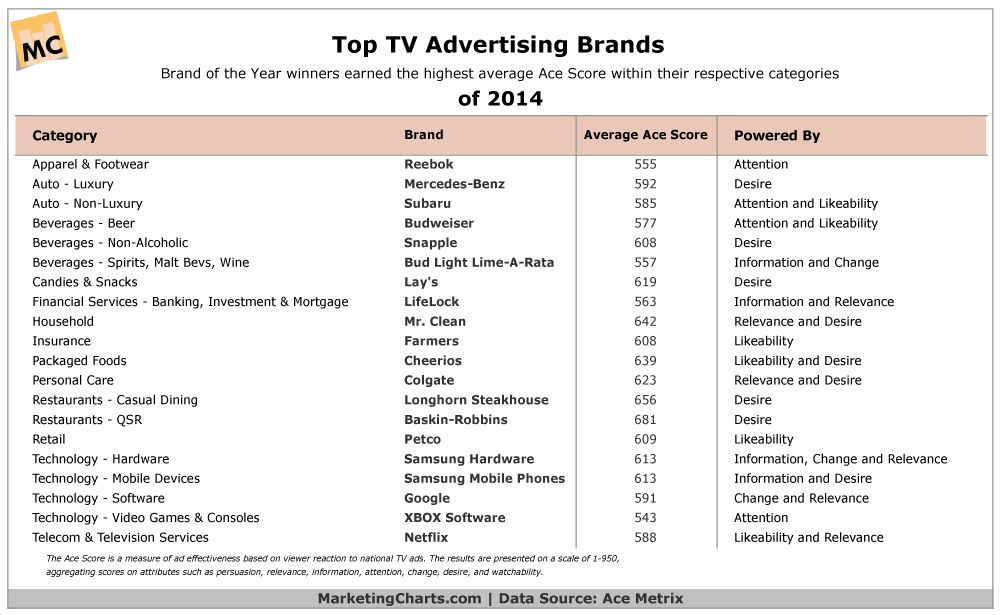
After being named the brand of the year in 2013, Google was in the thick of things again in 2014.
Read MoreUS Mobile Display Ad Spending, 2013-2018 [CHART]
On the whole, cost-per-thousand (CPM) averages in 2014 were on par or above 2013 rates.
Read MoreTop 5 Countries In Ad Spending, 2015 [TABLE]
Around the world, advertisers will spend $592.43 billion in 2015, an increase of 6.0% over 2014.
Read MoreDisplay Ad Viewability Rates By Ad Size, July 2014 [CHART]
Vertical ad units were consistently the most viewable. Worldwide, 120×240 placements performed the best for viewability, with a rate of 55.6%.
Read MoreMobile Display Ad Viewability Metrics By Ad Size, Q3 2014 [TABLE]
Screenwide display ads on mobile were tops for viewability.
Read MoreDesktop Display Ad Viewability & Engagement Metrics By Ad Size, Q3 2014 [TABLE]
970×250 ads had the highest in-view rate out of desktop display ads studied worldwide during Q3 2014, at 65.8%.
Read MoreMarketers' Retargeting Challenges, August 2014 [CHART]
Difficulty attributing performance was the No. 1 challenge of retargeting, cited by 43% of respondents.
Read MorePrimary Online Attribution Models Used By Marketers, July 2014 [CHART]
91% of those marketers said attribution was important.
Read MoreCorrelation Between Organic & Paid Mobile App Installs, August 2014 [TABLE]
In most app categories, there is a correlation between paid app installs and organic distribution of the same apps.
Read More