Advertising
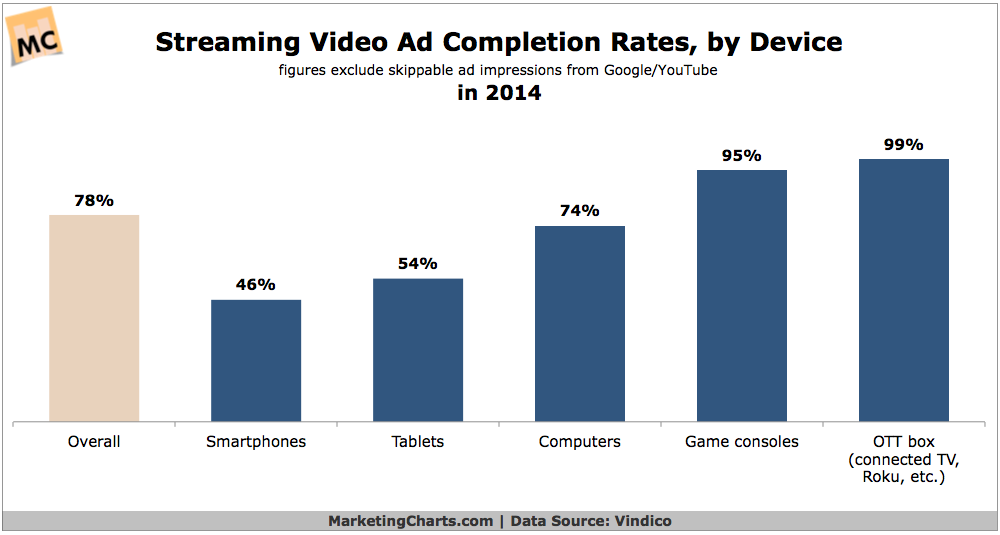
Streaming Video Ad Completion Rates By Device Type, 2014 [CHART]
Streaming video ad completion rates were lower on devices with smaller screens last year.
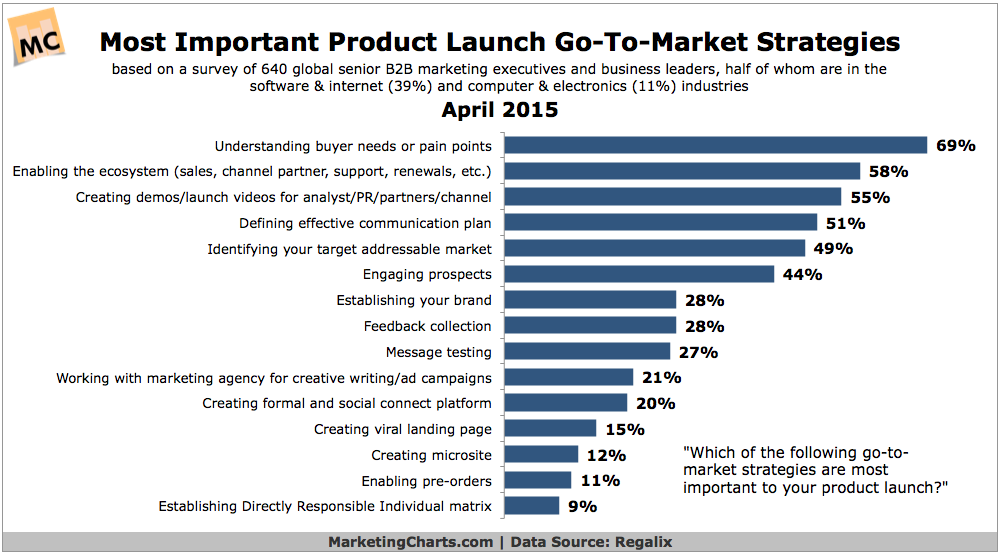
Read MoreTop Product Launch Go-to-Market Strategies, April 2015 [CHART]
Understanding buyer needs or pain points counts as the most important go-to-market strategy for a product launch.
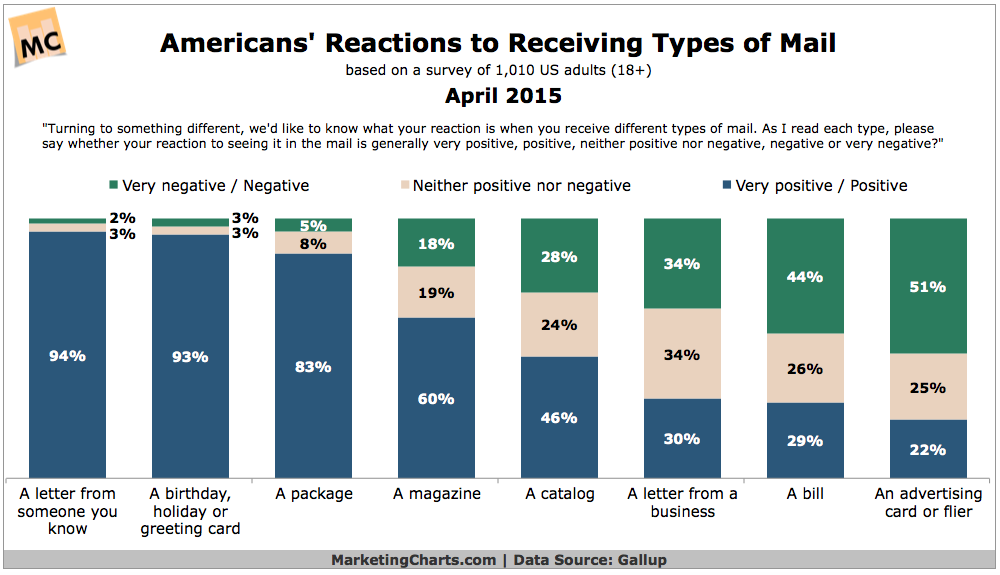
Read MoreConsumer Attitudes Towards Direct Marketing, April 2015 [CHART]
US adults are more likely to have a positive than negative reaction to seeing a catalog in the mail.
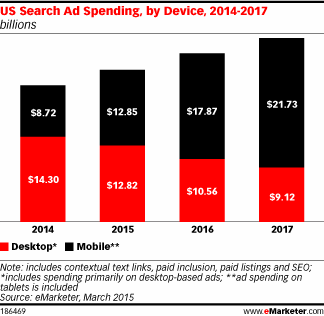
Read MoreUS Search Ad Spending By Device, 2014-2017 [CHART]
eMarketer expects mobile to overtake desktop for US search ad dollars this year, rising from $8.72 billion to $12.85 billion.
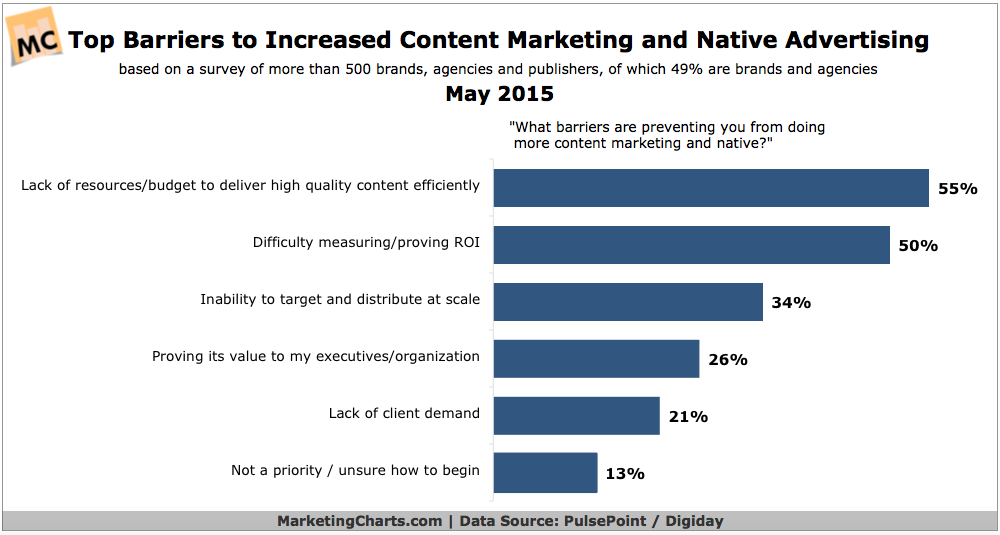
Read MoreBarriers To Increasing Content Marketing & Native Advertising, May 2015 [CHART]
Most brands and agencies say that content marketing plays a significant role in their overall marketing strategy, with native advertising playing somewhat of a less significant role for the time being.
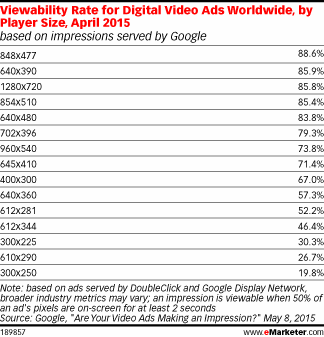
Read MoreViewability Rates By Video Ad Dimensions, April 2015 [TABLE]
According to April 2015 research by Google, shelling out for larger ad sizes could help boost viewability.
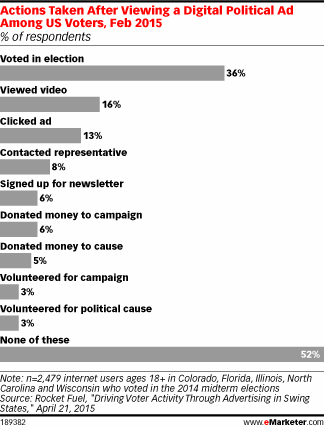
Read MoreWhat US Voters Do After Viewing An Online Political Ad, February 2015 [CHART]
Nearly half of US voters in the 2014 midterm elections from five swing states took some sort of action after viewing a online political ad.
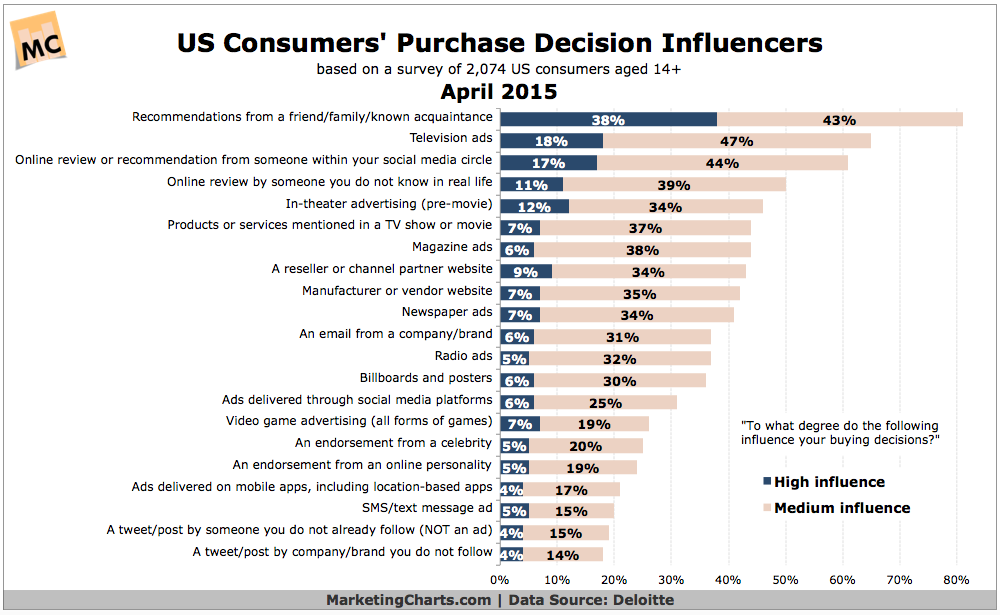
Read MoreTop Influences Over US Consumers' Purchase Decisions, April 2015 [CHART]
When it comes to influencing consumers’ purchases, word-of-mouth continues to outperform all paid media.
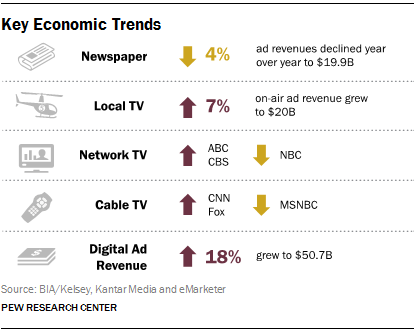
Read MoreNews Media Economics Trends [INFOGRAPHIC]
Newspaper ad revenue declined another 4% year over year, to $19.9 billion – less than half of what it was a decade ago.
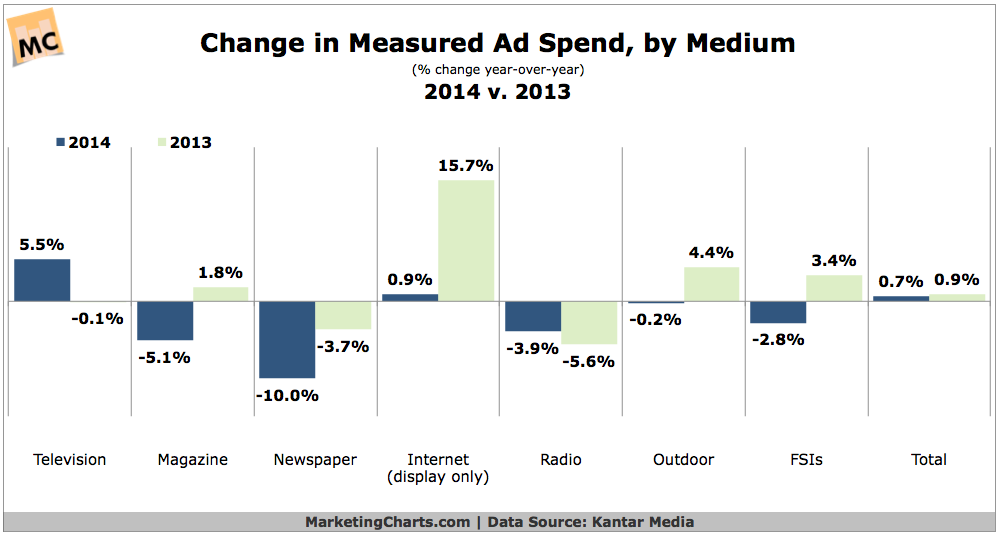
Read MoreChange In Ad Spending By Medium, 2013 vs 2014 [CHART]
After growing by 0.9% in 2013, US advertising expenditures maintained a similar rate of growth of 0.7% in 2014 to reach $141.2 billion.
Read More