Advertising
Q3 Internet Advertising Revenues, 2001-2012 [CHART]
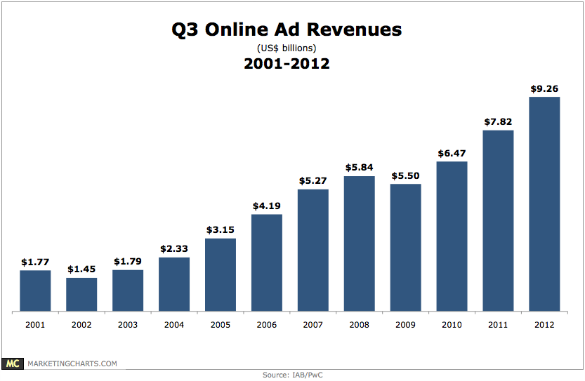
Online ad revenues continue to climb at double-digit rates, growing 18% year-over-year in Q3 from $7.82 billion to $9.26 billion.
Read MoreOnline Video Ad Views, January – November 2012 [CHART]
Americans watched 10.5 billion video ads in November, down slightly after October’s spike of 10.9 billion, but still fairly steady after a summer lull.
Read MoreTop 10 YouTube Video Ads Of 2012 [LIST]
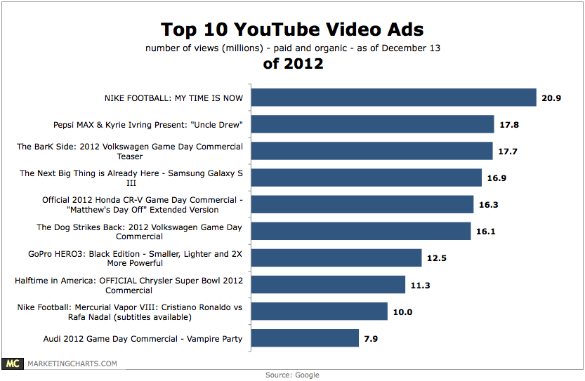
Google’s list of top YouTube ads (in terms of total views) features a mix of sports, automotive, and tech brands.
Read More10 Most Liked Commercials Of 2012 [LIST]
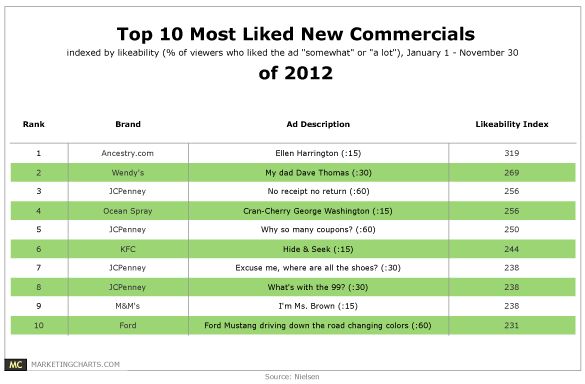
Nielsen has released its lists of most liked new commercials for 2012.
Read MoreGlobal eTailing Challenges, November 2012 [CHART]
The leading challenge for eTailers was improving conversions, cited by 63.1% of respondents.
Read MoreUS Total Media Ad Spending Share By Channel, 2010-2016 [CHART]
Just 2.4% of total ad spending in the US will go toward mobile ads in 2012.
Read MoreUS Net Mobile Display Ad Revenue Share By Company, 2011-2014 [CHART]

Facebook is set to garner an 18.4% share of the US mobile display advertising market this year.
Read MoreUS Net Mobile Advertising Revenues By Company, 2011-2014 [CHART]
eMarketer estimates Facebook’s US mobile ad revenues will hit $339 million in 2012.
Read MoreUS Mobile Advertising Spending, 2010-2016 [CHART]
eMarketer expects overall spending on mobile advertising in the US, including display, search and messaging-based ads served to mobile phones and tablets, to rise 180% this year to top $4 billion.
Read MoreAd Agency Interest In Social Media By Sites, Q3 2009 – Q3 2012 [CHART]
Q3 2012 findings from media buying and solutions provider STRATA showed 91.9% of ad agencies were using social media.
Read More