Advertising
The Super Bowl & Social Ads [INFOGRAPHIC]
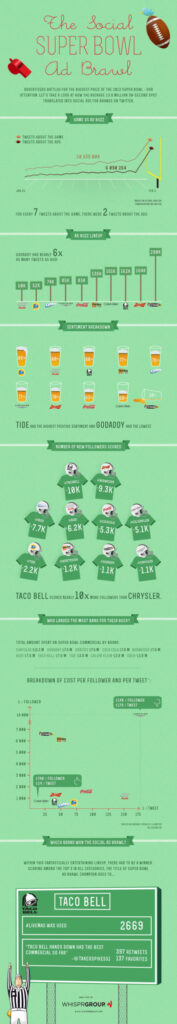
This infographic illustrates that of the 20.9 million Super Bowl XLVII-related tweets sent during the game, nearly 30% were about the ads.
Read MoreB2B Marketing Channels By Lead Quality, November 2012 [TABLE]
Two in five said their own email campaigns produced predominantly high-quality leads; 36% said the same of leads that came in through SEO.
Read MoreB2B Marketing Channels By Lead Volume, November 2012 [TABLE]
When it comes to marketing tactics best suited to turning up high volumes of leads, marketers most frequently cited the work of third-party lead generators at 34%.
Read MoreTop Global B2B Marketing Channels, November 2012 [CHART]
Nearly all B2B marketers surveyed reported maintaining email lists and doing search engine optimization.
Read MoreeCommerce Traffic Share By Source, Q4 2011 – Q4 2012 [CHART]
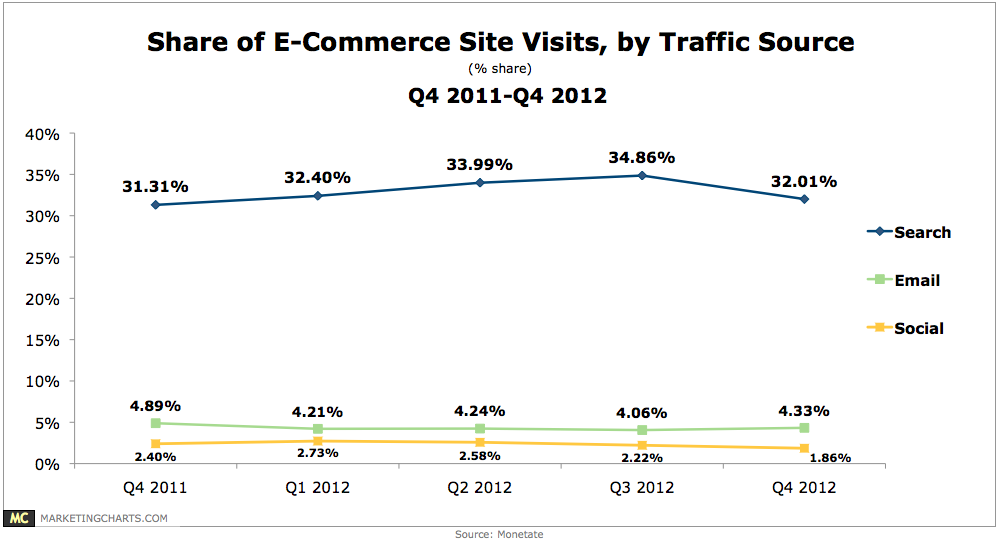
Search engines still dwarf email and social media as an e-commerce traffic driver.
Read MoreVideo Ad Completion Rates by Video Length, Q1 2011 – Q4 2012 [CHART]
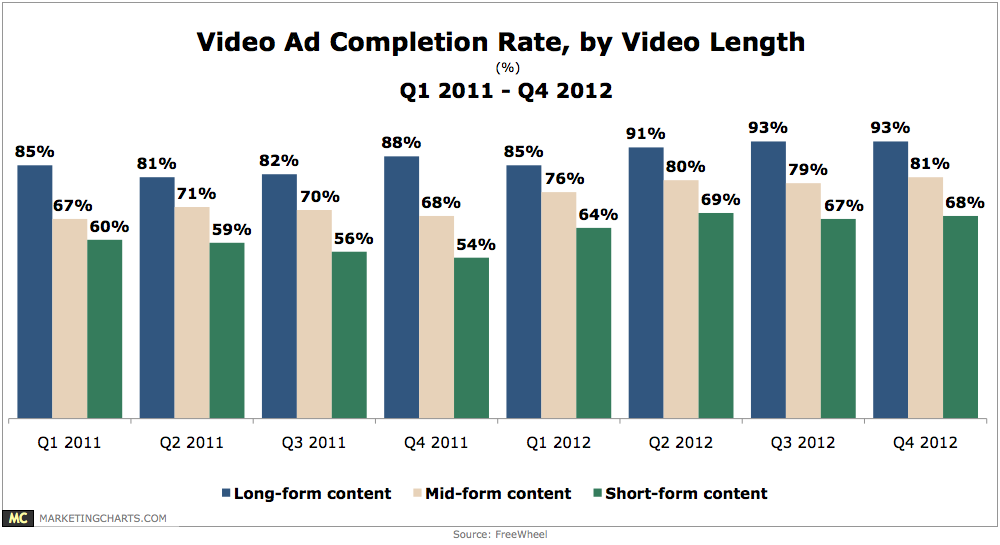
Despite packing in an average of 2.5 more ads per video in Q4 than in Q3 (9.4 vs. 6.9), the completion rate for ads in long-form content (20+ minutes) held steady at 93% in Q4.
Read MoreMobile Ad Traffic Monetization By Device, Q4 2012 [TABLE]
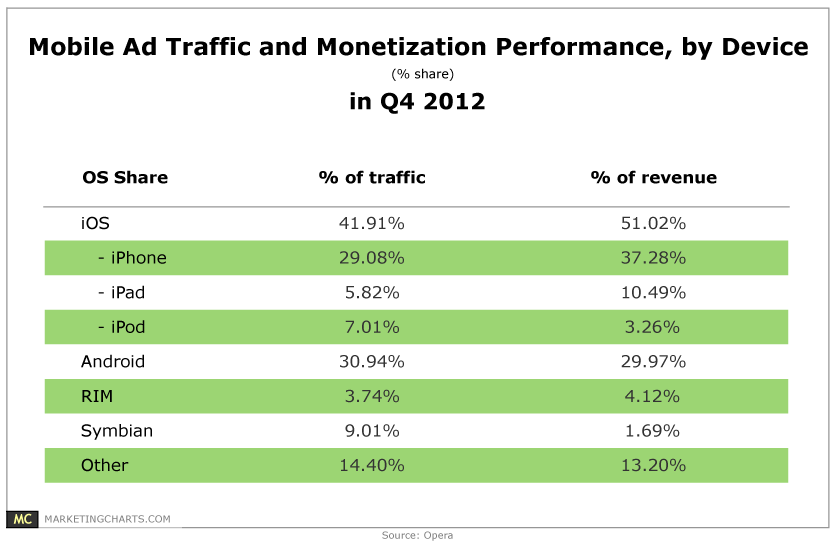
Among mobile platforms, Apple’s iOS leads in monetization performance on the Opera Advertising mobile platform.
Read MoreFacebook Ad Metrics, Q4 2012 [CHART]
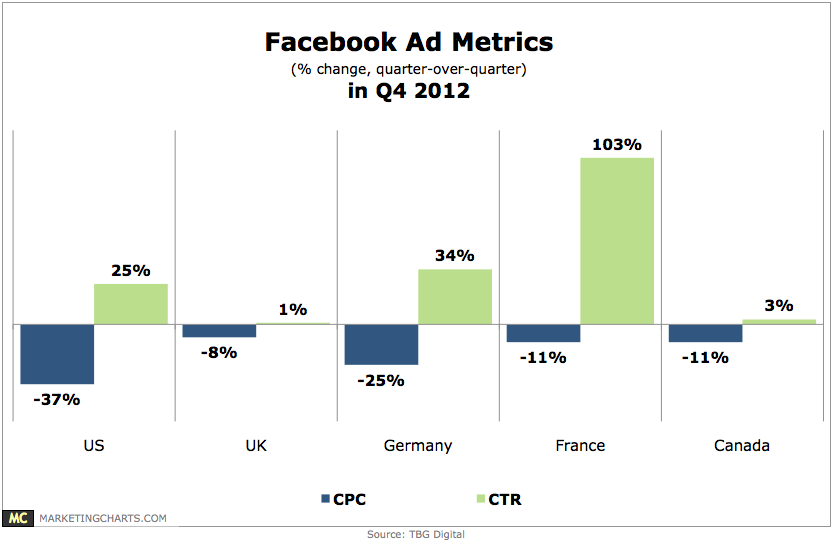
After falling by 40% between Q2 and Q3, the cost of advertising on Facebook in the US dropped by another 37% in Q4.
Read MoreMost Memorable 2013 Super Bowl Ads [TABLE]

With an average of 108.7 million viewers for the game, brands certainly had an opportunity to reach a huge audience. So which brands fared best?
Read MoreUS Retail Facebook Newsfeed Ad CTR & CPC For Mobile vs. Desktop, January 2013 [TABLE]
Mobile newsfeed ads achieved a considerable clickthrough rate of 3.38%.
Read More