Advertising
Twitter's Global Mobile Ad Revenues, 2012-2015 [CHART]
Twitter will earn $308.9 million in mobile ad revenue in 2013—which is more than the company earned in total, from any ad type, in 2012, when it made $138.4 million from mobile ads.
Read MoreTwitter's Global Ad Revenues, 2011-2015 [CHART]
More than half of Twitter’s ad revenues—about 53%—will come from mobile advertising this year, up from virtually no ad revenue from mobile in 2011.
Read MoreUS Mobile Search Advertising Metrics By Device, Q1 2013 [CHART]
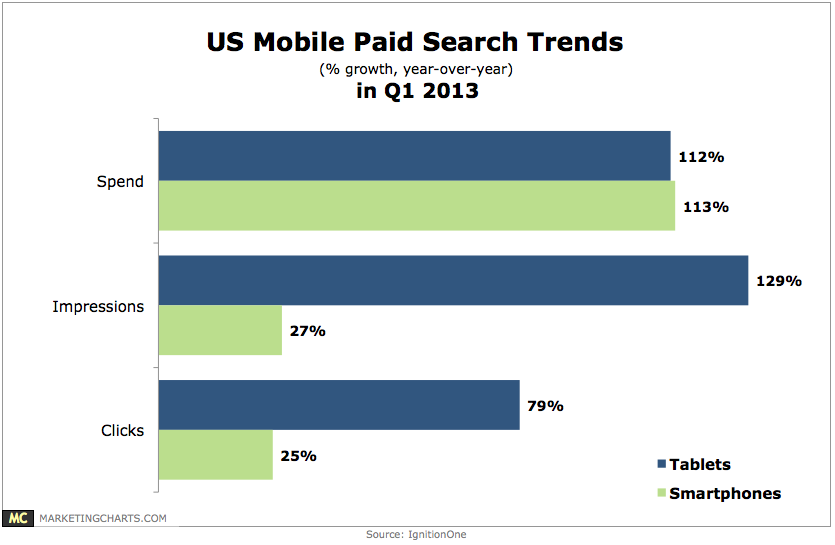
Search advertising spending on tablets increased by 113% year-over-year in Q1 2013, representing 64% of mobile search spend.
Read MoreBeyond Social Media: Ford Stung by Agency, Fining Bloggers & HBO Go Unleashed [PODCAST]

This week’s highlights: Ford Stung by Agency; Social Tiger Haters; NRA’s Robocalls; Fining Bloggers; HBO Go Unleashed? Amazon’s Zombies & Reddit’s Five Year Olds & Illustrating Keynotes.
Read MoreMost Influential Ad Type By Age, June 2012 [CHART]
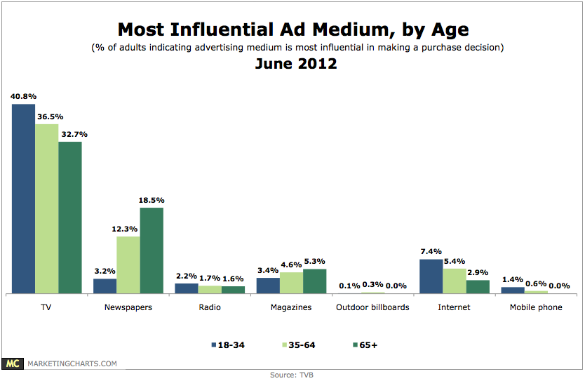
When asked the advertising medium they find most influential in making a purchase decision, 37.2% of American adults singled out TV – almost quadruple the proportion who pointed to the nearest competitor, newspapers (10.6%).
Read MoreUS Television Ad Spending vs. Audience Growth, Q1 2011 – Q4 2012 [CHART]
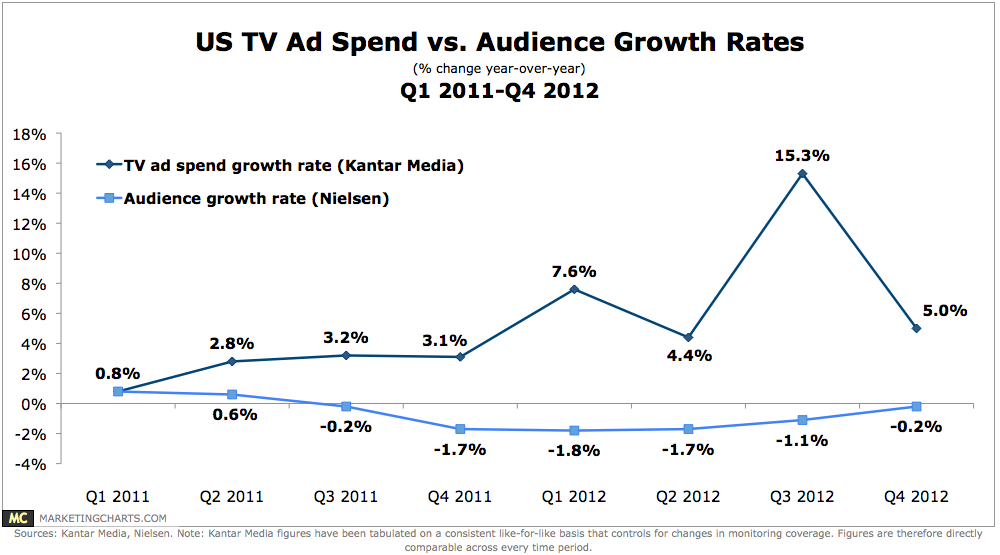
TV ad spending growth continues to be healthy even as its audience size declines.
Read MoreUS Television Ad Spending Growth vs. Overall Average, Q1 2011 – Q4 2012 [CHART]
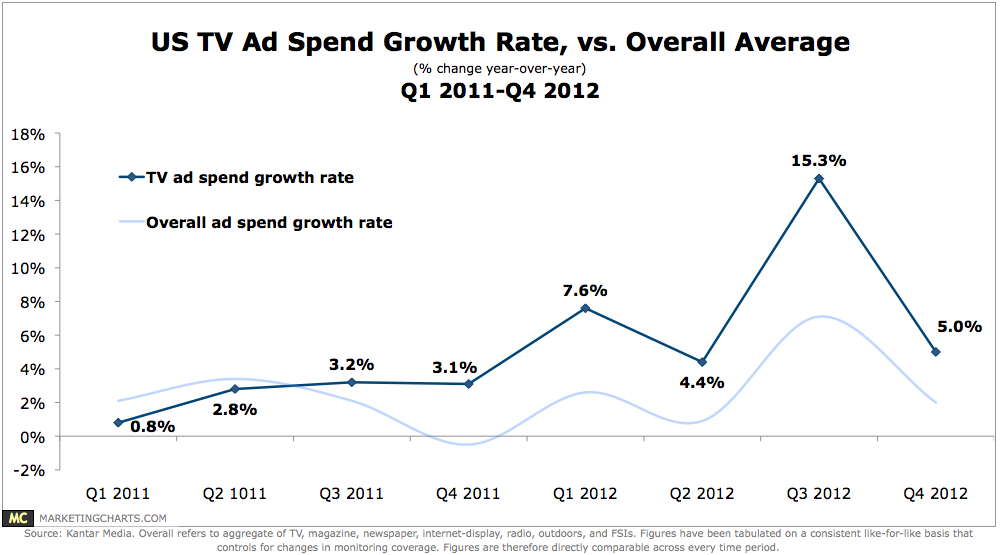
TV ad spending growth rates in the US continue to outpace the aggregate of all media.
Read More
Native Video Ads vs Pre-Roll, March 2013 [CHART]

Native videos drove higher brand lift in each of the 5 campaigns studied compared to pre-roll video ads.
Read MoreTop Prompts For Trying New Fashion Retailers, March 2013 [CHART]
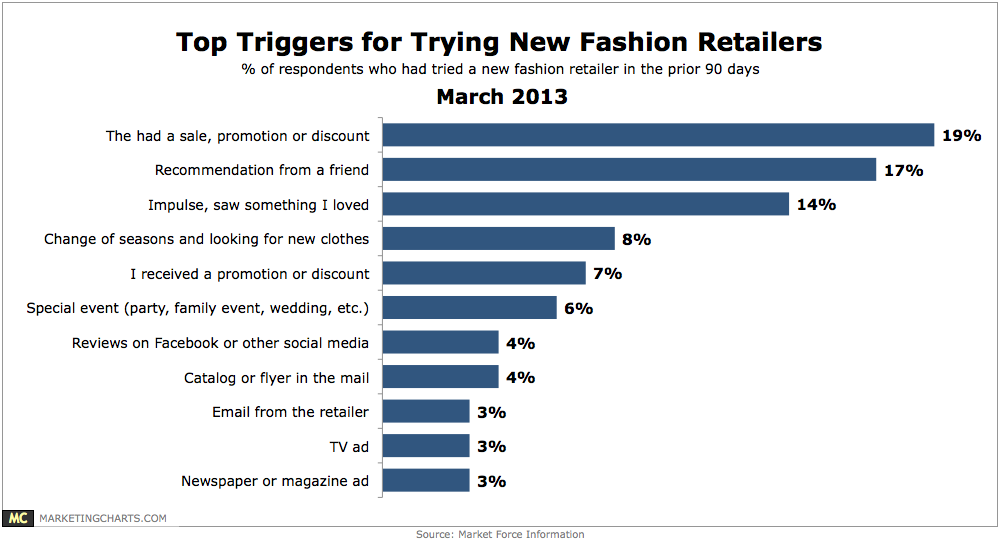
39% said they had tried out a new retailer in the previous 90 days, up 22% from 2011, and almost triple the 14% from 2010.
Read More