Advertising
US Mobile Search Ad Revenues, 2011-2015 [CHART]
Google is by far the largest player with 93.3% of US net mobile search ad dollars going to the company last year.
Read MoreUS Net Mobile Ad Revenues By Channel, 2011-2015
eMarketer revised its estimate for 2012 spending only slightly upward from the previous forecast in December 2012.
Read MoreUS Mobile Ad Spending, 2011-2017 [CHART]
US mobile advertising spending grew 178% last year to $4.11 billion.
Read MoreIn-Stream Video Ad Response Rates By Gender, 2012 [TABLE]
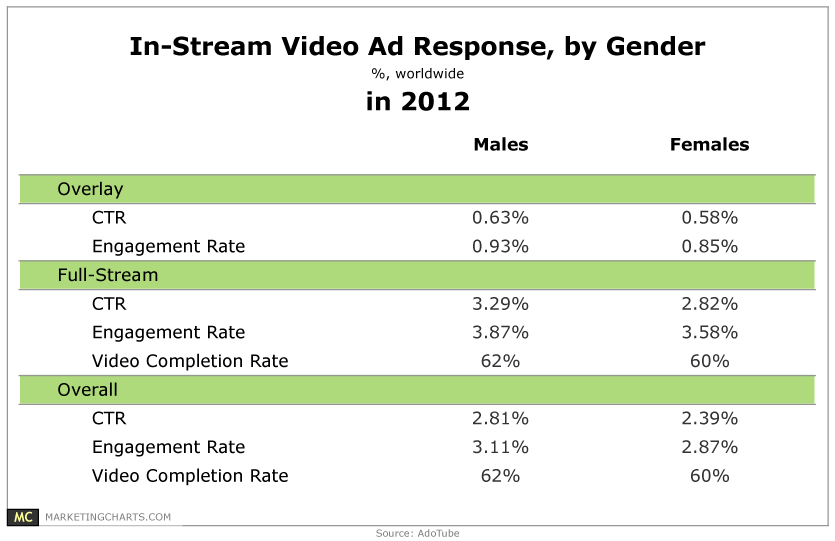
Men responded more to in-stream video ads than women, with a 17.6% higher click-through rate (CTR; 2.81% vs. 2.39%).
Read MoreUS TV vs Digital Video Ad Spending, 2011-2017 [CHART]
Spending on video ads served to PCs and mobile devices is expected to reach $4.14 billion this year, more than twice 2011 levels.
Read MoreUS Television vs. Online Ad Spending, 2011-2017 [CHART]
Advertisers will spend $66.35 billion on TV this year, up from $64.54 billion in 2012 and set to rise to over $75 billion by 2017.
Read MoreVideo Advertising Impressions By Format, 2010-2012 [CHART]
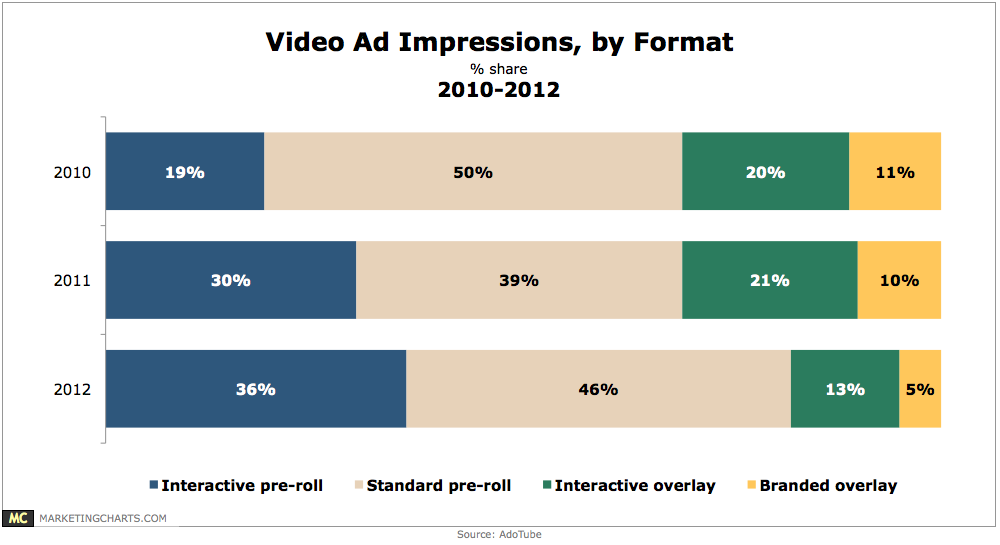
Interactive pre-rolls represented 36% of video ad impressions in 2012.
Read MoreBeyond Social Media: Macy's $1,453 Typo; Yelp Reviews; Prankvertising; Kevin Ware & Social Empathy [PODCAST]

This week: Macy’s $1,453 Typo; Yelp’s Filtered Reviews; Nike’s Winning Ad Lampooned; Prankvertising; Kevin Ware & Social Empathy; Silent Instagram Film Trailers; Punch Pizza Goes To Naples; HP’s Bouncing Cam; Blogging Rules; Shiny New Stuff & Daily Numbers.
Read MoreGrowth Of Mobile Real-Time Bidding Ads, Q1-Q4 2012 [CHART]
While less than 10% of mobile ads served were purchased via RTBs in Q1 2012, that share climbed to nearly two-thirds in Q4.
Read MoreGlobal Mobile Ad Spending Share By Vertical, Q4 2012 [CHART]
The worst performers on tablets vs. smart phones were the fast-moving consumer goods and retail industry, along with the social and dating category.
Read More