Advertising
US Facebook Net Ad Revenues, 2011-2015 [CHART]
eMarketer estimates that after less than a full year selling mobile ads, 18% of US net Facebook ad revenues came from mobile in 2012.
Read More
US Digital Ad Spending By Channel, 2011-2017 [CHART]
Desktop ad spending will peak in 2014 at $35.39 billion, up from this year’s projected total of $34.29 billion.
Read MoreUS Traditional Media Revenue Outlook, 2013-2017 [CHART]
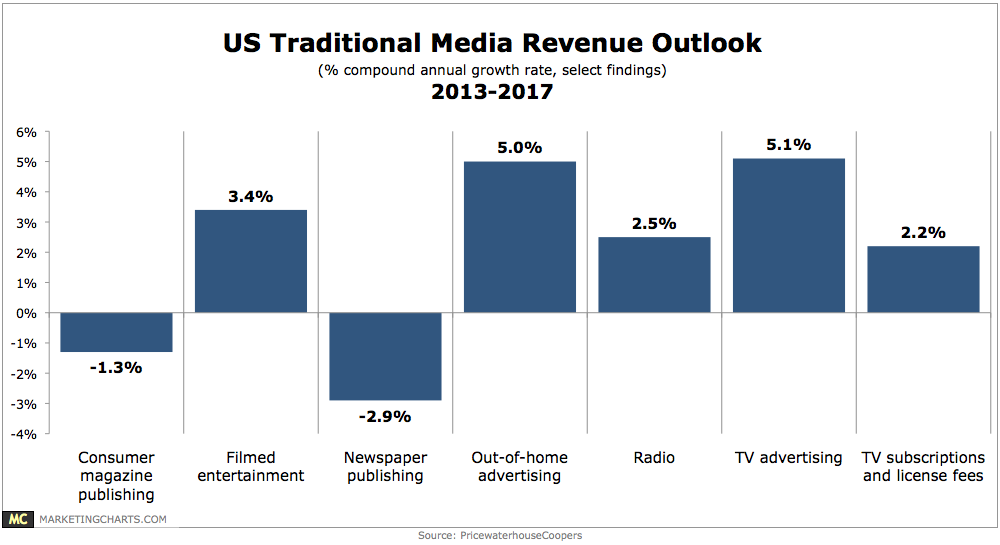
PwC has issued its annual “Entertainment & Media Outlook” report, which contains projections for online and offline media markets through 2017.
Read MoreTablet Ad Categories To Which Users Are Most Likely To Respond By Gender, January 2013 [CHART]
The content that beauty consumers devour in magazines are ripe for the interactive opportunities that tablets can provide.
Read MoreUS Print vs. iPad Magazine Ad Units, Q1 2012 & Q1 2013 [TABLE]
The number of ad units available on just the iPad increased nearly 24%, giving the iPad editions 56% of the total number of ad units as on print pages.
Read MoreAmericans Who Click On Search Engine Ads By Age, August 2012 [CHART]
US internet users in the 18-to-34 age bracket were much more likely than older respondents—30% vs. 18%—to have clicked on ads in search engines.
Read MoreNewspaper Circulation & Advertising Trends By Region, 2012 [CHART]
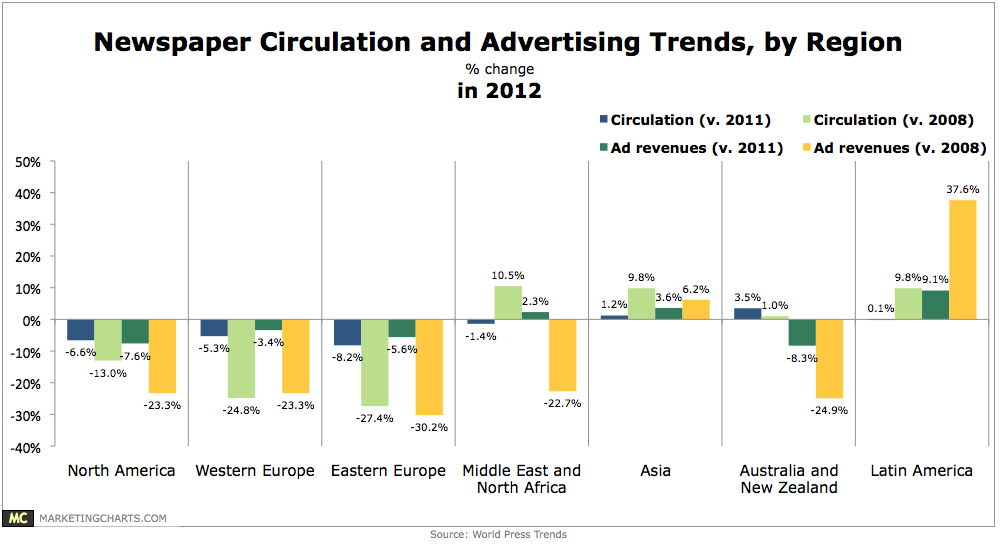
Newspaper circulation around the world dropped by only 0.9% in 2012, as losses in North America and other regions were almost completely offset by gains in Asia.
Read MoreQ1 Online Ad Revenues, 1996-2013 [CHART]
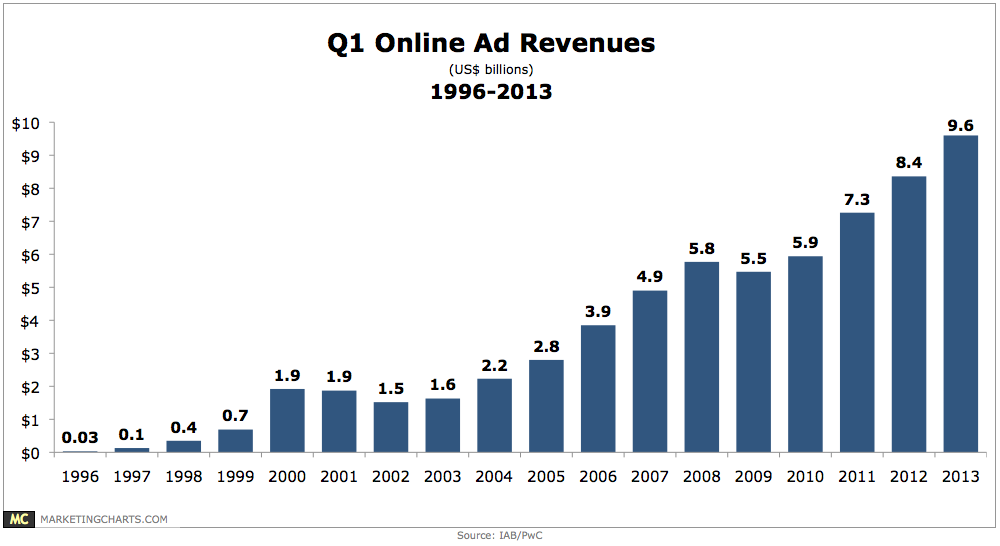
Online ad revenues grew by 15.8% year-over-year in Q1, increasing from $8.3 billion to $9.6 billion.
Read MoreAutomating Marketing Decision-Making Process By Channel, 2013 [CHART]
The key to real-time marketing is to use data and analysis to deliver automated real-time messaging, which can rapidly respond to customer actions.
Read More