Advertising
US Mobile Display Ad Revenues By Company, 2011-2015 [TABLE]
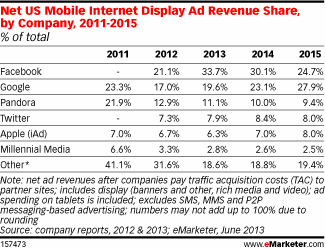
Facebook is the leading player and will rake in just over one in three mobile display dollars this year, after traffic acquisition costs (TAC).
Read MoreUS Mobile Search Ad Revenues By Company, 2011-2015 [TABLE]
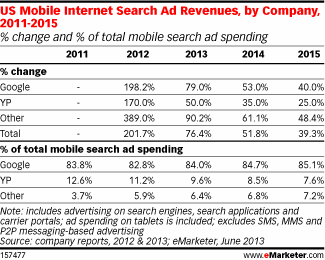
Google alone took in 82.8% of all mobile search ad revenues last year.
Read MoreGlobal Net Online Ad Revenues By Company, 2011-2013 [TABLE]
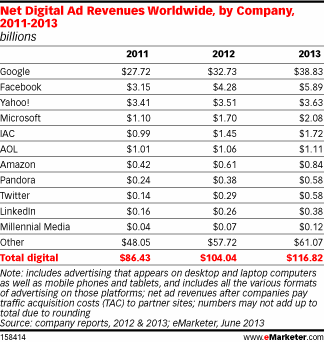
Both Google and Facebook are increasing revenues at faster rates than the overall digital ad spend market.
Read MoreGlobal Online Ad Revenue Share By Company, 2011-2013 [TABLE]
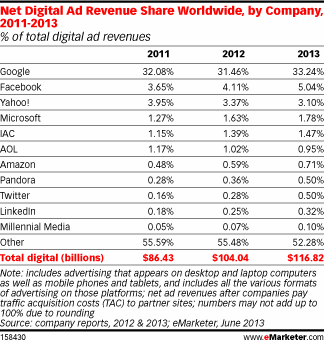
Google continues to reign as not only the largest beneficiary of digital ad spending in the US, but worldwide as well.
Read MoreGlobal Mobile Ad Revenue Share By Company, 2011-2013 [TABLE]
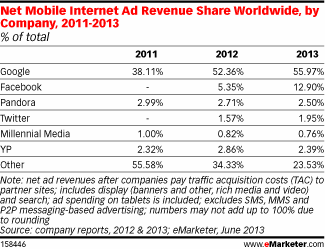
Twitter is also expected to see its worldwide mobile ad spending share increase this year to about 2% of the total, eMarketer estimates.
Read MoreGlobal Mobile Ad Revenues By Company, 2011-2013 [TABLE]
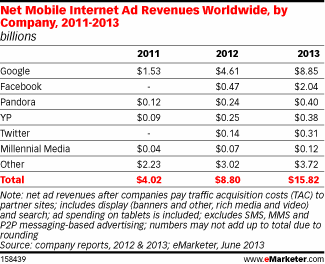
eMarketer estimates that Google made $4.61 billion in mobile internet ad revenues last year, more than triple its earnings in 2011.
Read MoreAd Spending Share Of US Automobile Dealerships By Media, 2002-2012 [TABLE]
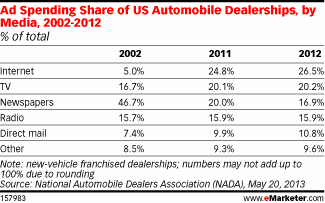
Dealers have dramatically increased their digital ad spending over the past decade, from just 5.0% of spending in 2002 to 26.5% in 2012.
Read MoreUS Automotive Online Ad Spending, 2011-2017 [TABLE]
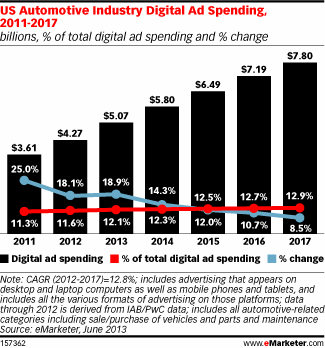
The US automotive industry will spend $5.07 billion in 2013 on paid digital advertising, and that total is expected to rise to $7.80 billion by 2017.
Read MoreUS Google Net Ad Revenues, 2011-2015 [TABLE]
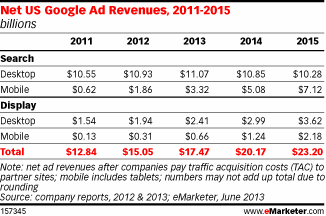
Mobile’s rapid expansion will help that channel rival the desktop in both search and display revenues for Google by 2015.
Read MoreUS Twitter Net Ad Revenues, 2011-2015 [CHART]
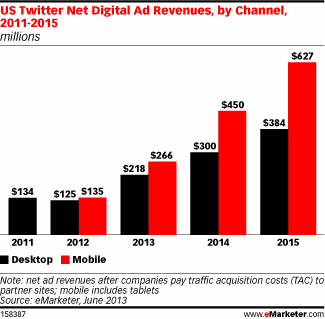
As of 2012, eMarketer estimates, 52% of Twitter’s net US ad revenues were from mobile; by 2015, the share will approach two-thirds.
Read More