Advertising
Global Facebook Advertising Performance Metrics By Industry, March 2013 [TABLE]
For overall Facebook ads served by industry, sports cost by far and away the most, at a CPM of $9.08.
Read MoreGlobal Facebook Cost Per Like By Industry, March 2013 [TABLE]
General retail and telecommunications had the most success generating page “likes,” at a rate of 0.11% and 0.10%, respectively.
Read MoreGlobal Facebook Ad Performance Metrics By Type, March 2013 [TABLE]
The sponsored check-in story achieved the highest clickthrough rate (CTR) by a significant margin.
Read MoreExpectation & Tolerance For Mobile Video Ads, June 2013 [CHART]
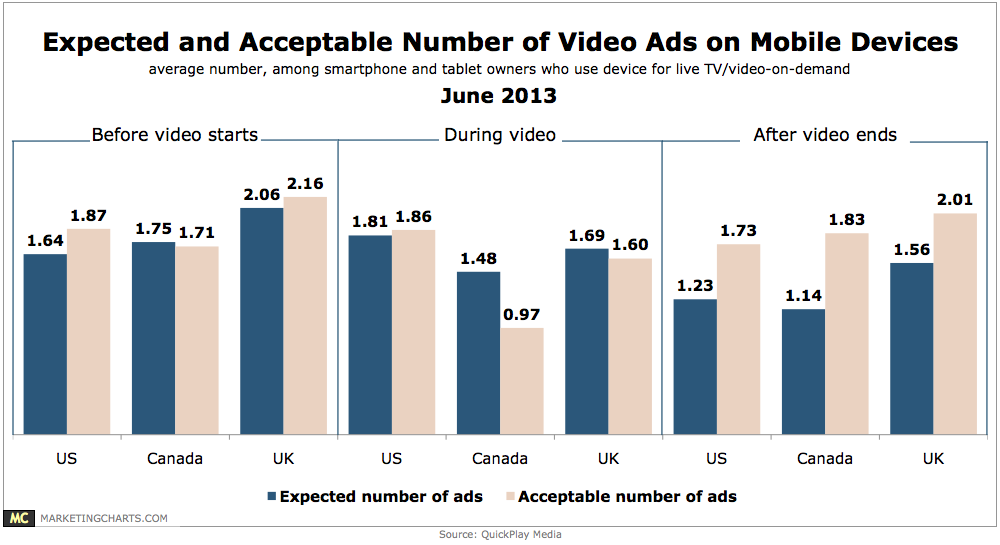
Research from comScore has shown that the average TV show is about one-quarter ads, while new figures from comScore indicate that online video ads accounted for just 2.6% of all minutes spent watching online video last month.
Read MoreAd Viewability Benchmarks By Site Type, 2012 [CHART]
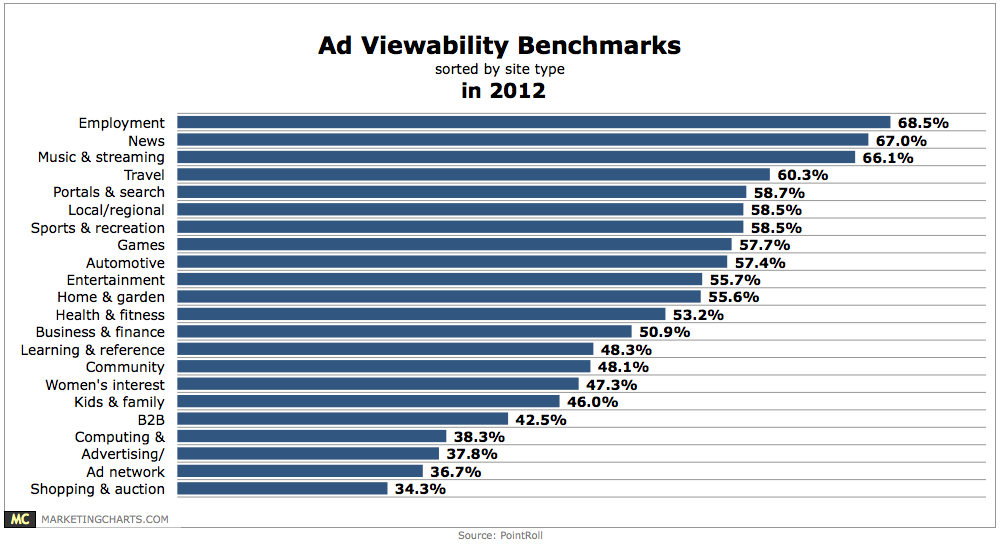
Covering 2012 activity, the data shows that viewability rates were lowest on shopping and auction (34.3%) and ad network (36.7%) sites, and highest on employment (68.5%), news (67%) and music and streaming media (66.1%) sites.
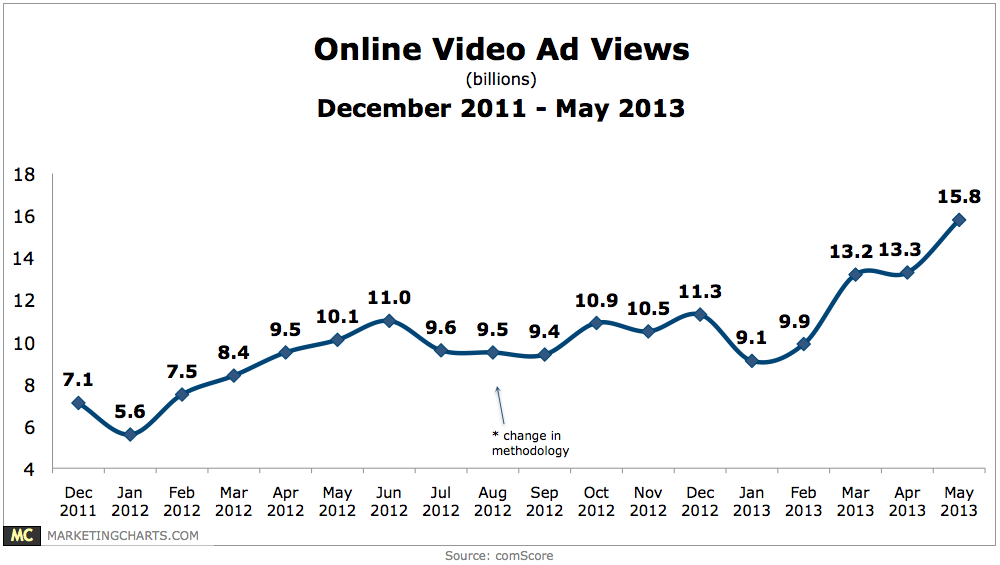
Read MoreOnline Video Ad Views, December 2011 – May 2013 [CHART]
In May, Americans watched an average of 96.5 ads each, up significantly from 81.6 the prior month.
Read MoreReach & Frequency Of Video Ads, January – May 2013 [CHART]
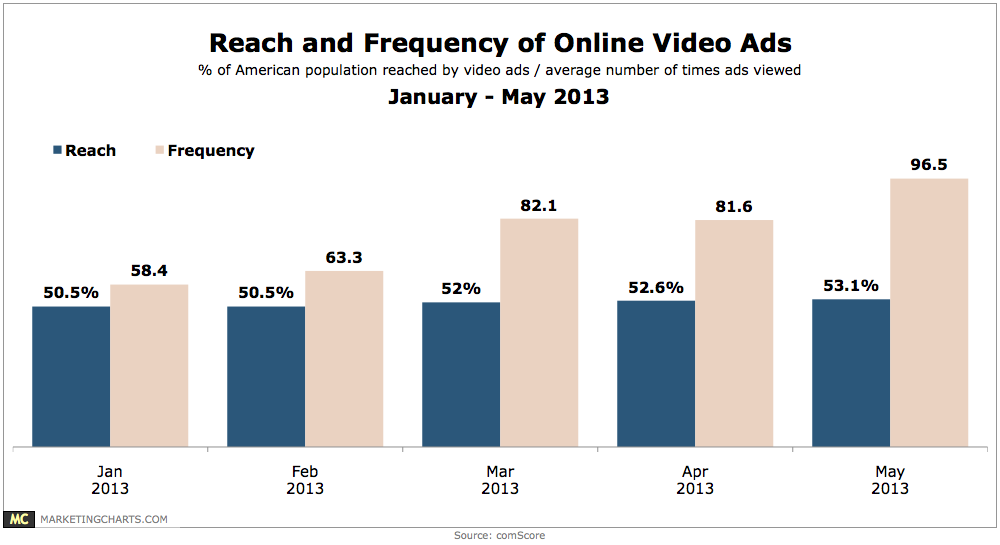
About 53% of the US population watched online video ads in May, relatively unchanged from April’s 52.6%.
Read MoreMost Important Multi-Screen Video Ad Metrics, June 2013 [CHART]
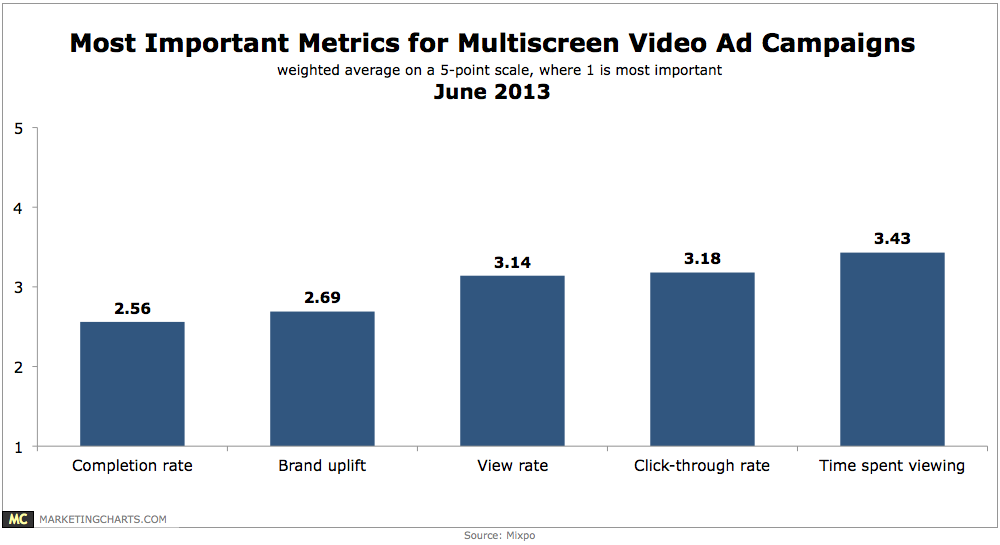
While completion rate (with a rating average of 2.56, where 1 is most important) shows up as the most important metric, brand uplift (2.69) is close behind in value.
Read MoreFactors That Influenced TV & VOD Consumption On Alternate Devices, June 2013 [CHART]
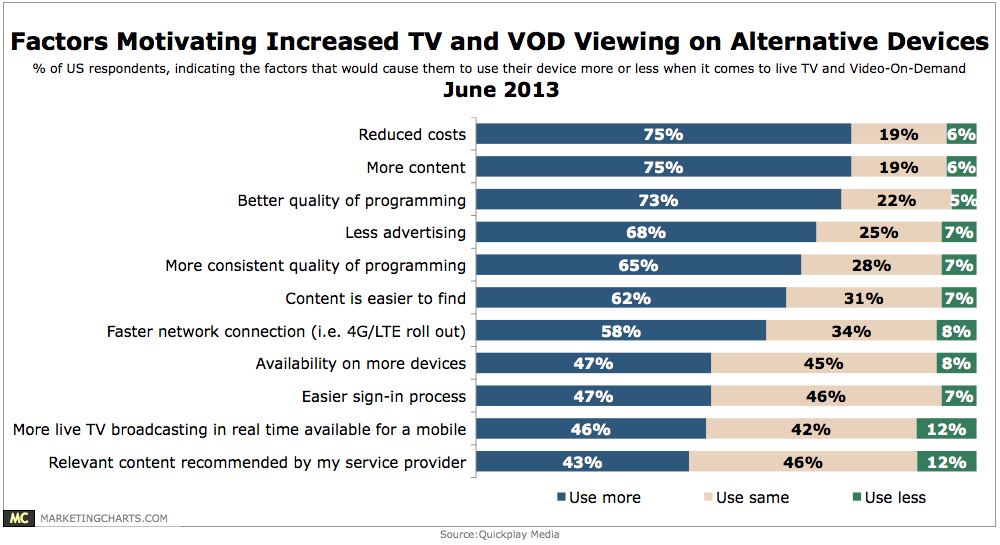
Roughly three-quarters of respondents in the US would be motivated to use their devices more for live TV and VOD viewing on account of reduced cost, more content, and better quality of programming.
Read MoreBenefits Of Video Email Marketing, February 2013 [CHART]
81% of respondents were at least somewhat likely to start putting videos into their emails.
Read More