Advertising
Facebook Exchange Advertising Effectiveness, January & September 2013 [CHART]
The number of respondents who said FBX was very effective for their ad campaigns rose from 11% in January 2013 to 20% in September 2013.
Read MoreMobile Facebook Ad ROI vs. Desktop Facebook Ad ROI, September 2013 [CHART]
35% of US marketers found the return on investment (ROI) from mobile at least somewhat greater than from desktop.
Read MoreReach & Frequency Of Video Ads, January – August 2013 [CHART]
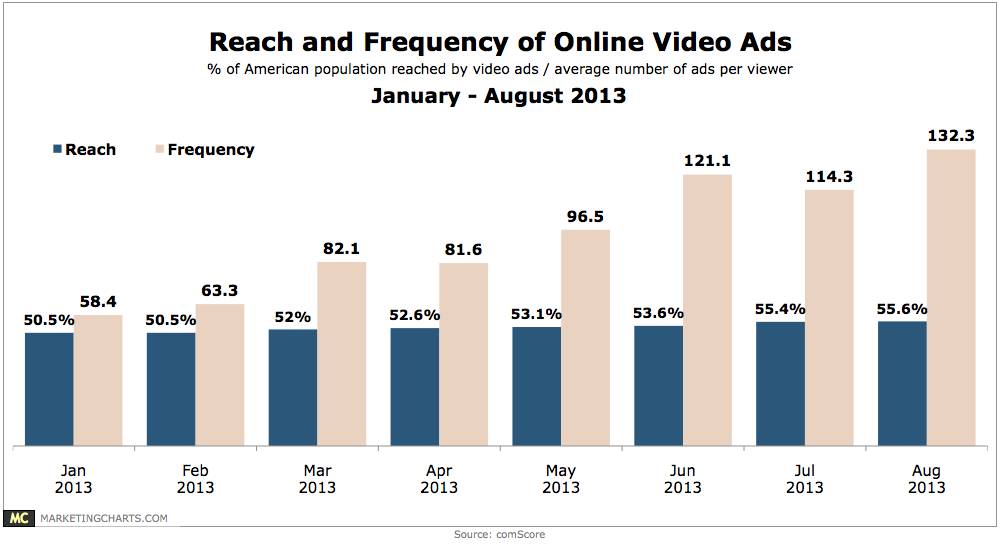
In August, the average viewer saw 132 ads, besting the previous high of 121 set in June, and more than doubling January’s average of 58.
Read MoreOnline Video Ad Views, December 2011 – August 2013 [CHART]
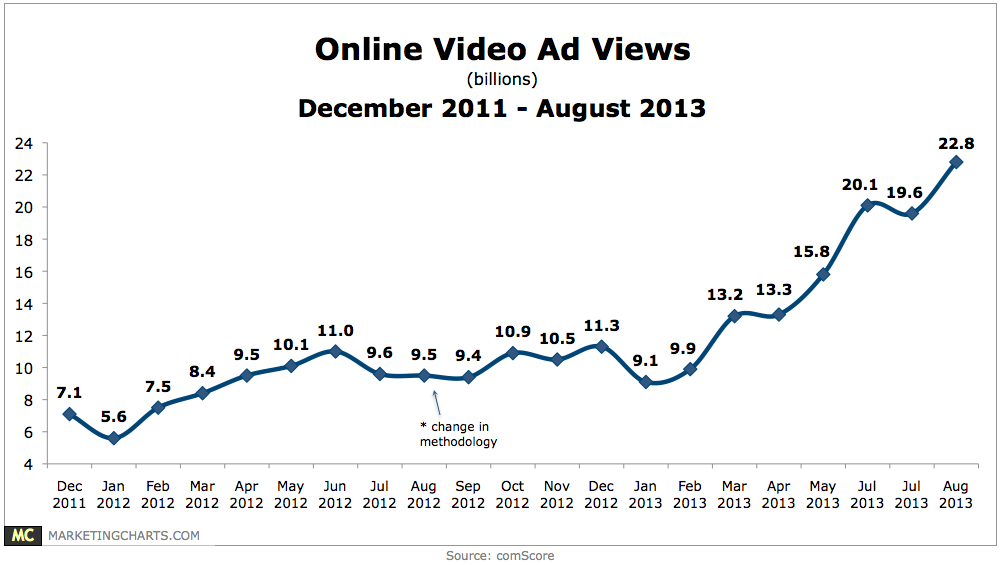
Online video ad views have been increasing rapidly this year, reaching a new high of 22.8 billion in August after a slight dip in July.
Read MoreGlobal Mobile Ad Spending By Region, 2011-2017 [TABLE]

Mobile spending will hit nearly $15.82 billion, representing a whopping 79.7% year-over-year increase.
Read MoreGlobal Ad Spending By Region, 2011-2017 [TABLE]

Global ad spending will rise 2.8% to more than half a trillion dollars in 2013.
Read MoreB2B Marketing Tactics, 2012 & 2013 [TABLE]
Websites were the most uniformly employed technique, used by 85% of those polled.
Read MoreNative Advertising & Content Creation Spending Plans, September 2013 [CHART]
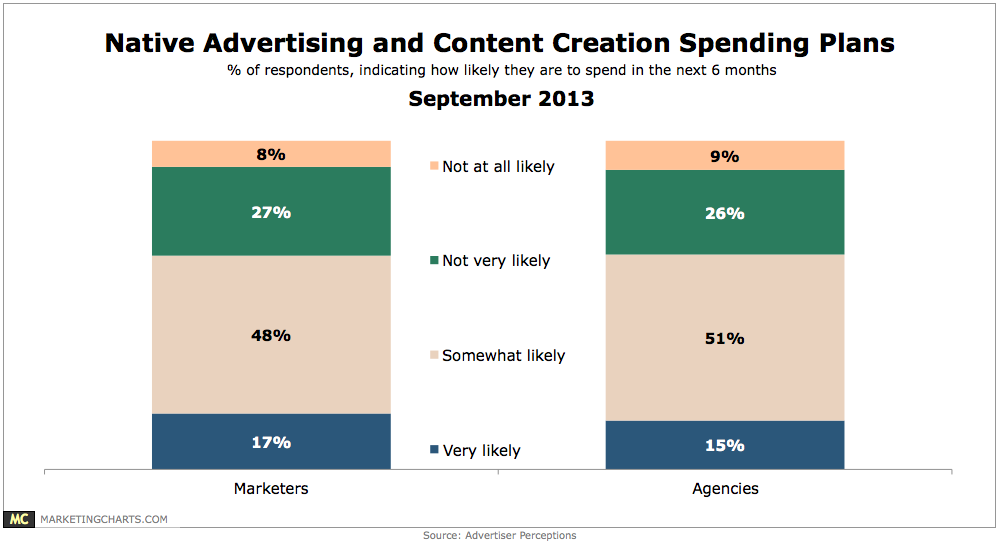
Roughly 2 in 3 marketers and agencies surveyed indicated that they are somewhat or very likely to spend on native ads and content creation in the next 6 months.
Read More
Brands' Use Of Facebook Ads To Increase Post Reach, September 2013 [CHART]
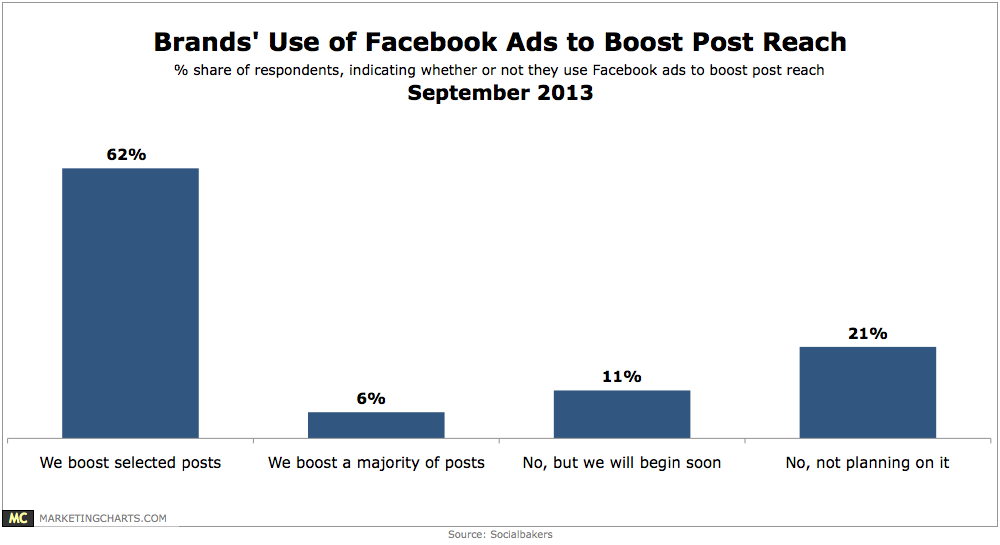
Roughly 8 in 10 marketers plan to increase their social media spending over the next 3 years, the majority of whom expect to hike their spending by upwards of 25%.
Read More