Advertising
Global Ad Spend Growth By Medium, H1 2013 [CHART]
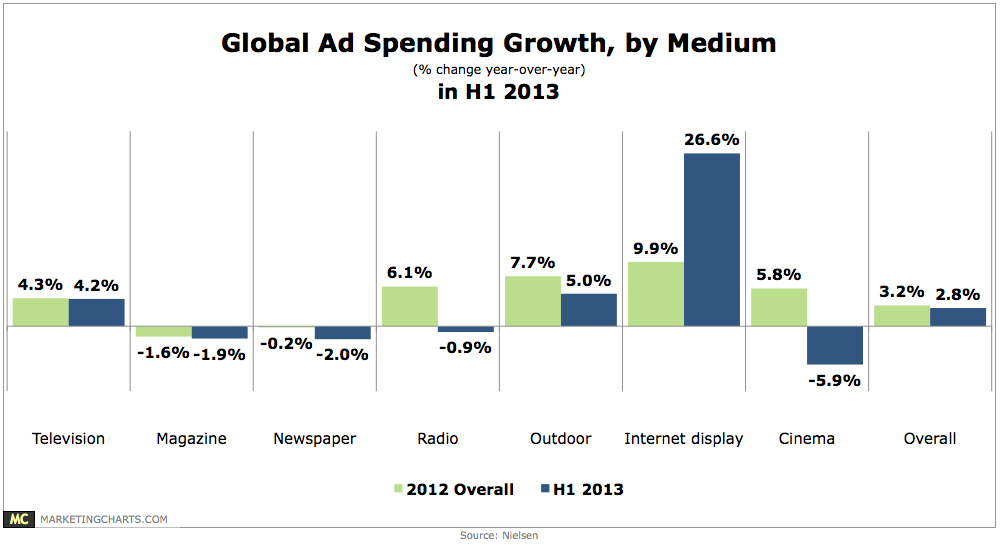
Global ad spending across major media grew by 2.8% year-over-year in the first 6 months (H1) of this year, with faster growth noted in Q2 (3.5%), particularly in June (5.8%).
Read MoreBenefits Of Card-Linked Marketing, October 2013 [CHART]
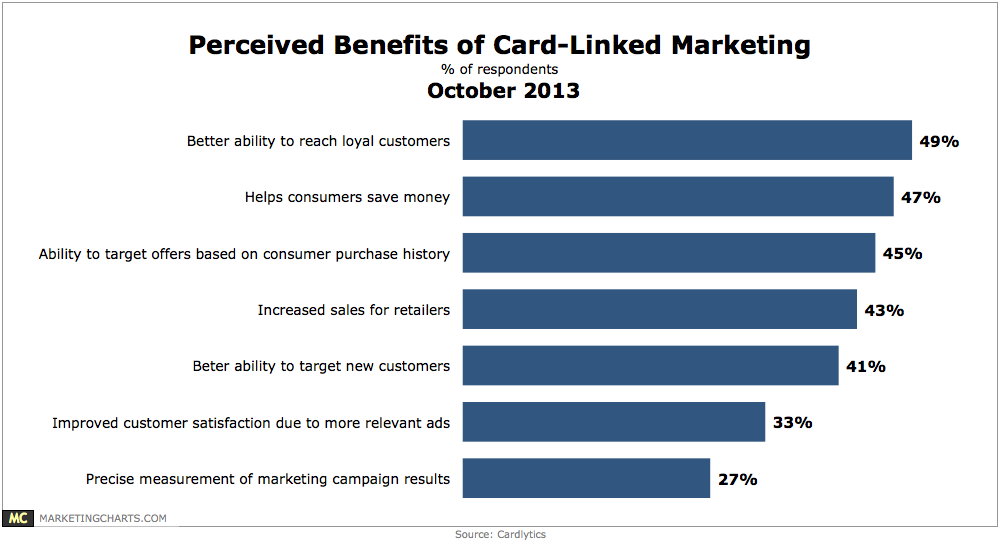
Almost 9 in 10 marketers believe that card-linked marketing (CLM) – advertising directly through consumers’ online and mobile banks statements with targeted cash-back offers based on purchase history – has benefits.
Read MoreValue Of TV vs Online Video Impressions, October 2013 [CHART]
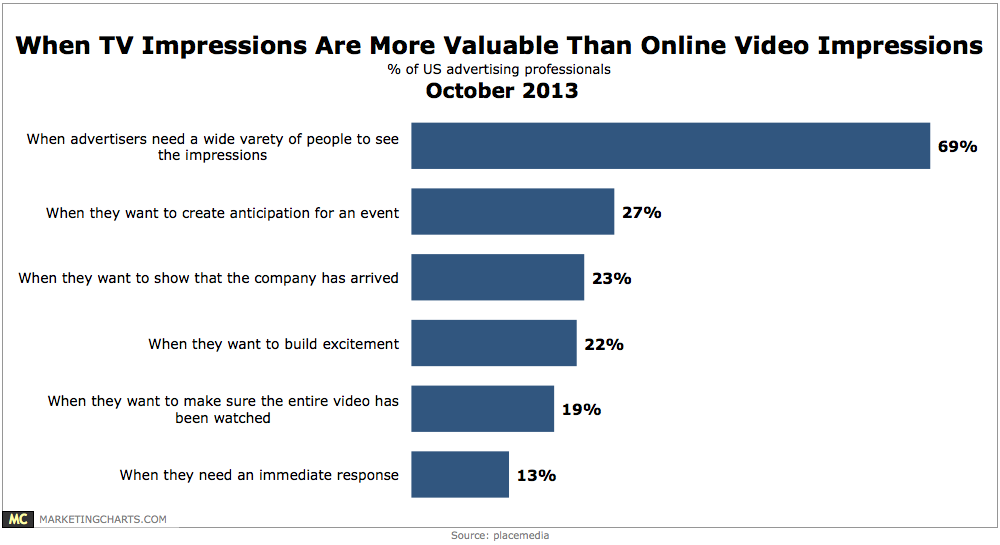
89% of advertising professional responding to the survey find that TV impressions are more important than online video impressions.
Read MoreMobile vs. Desktop Video Engagement Rates, Q3 2013 [CHART]
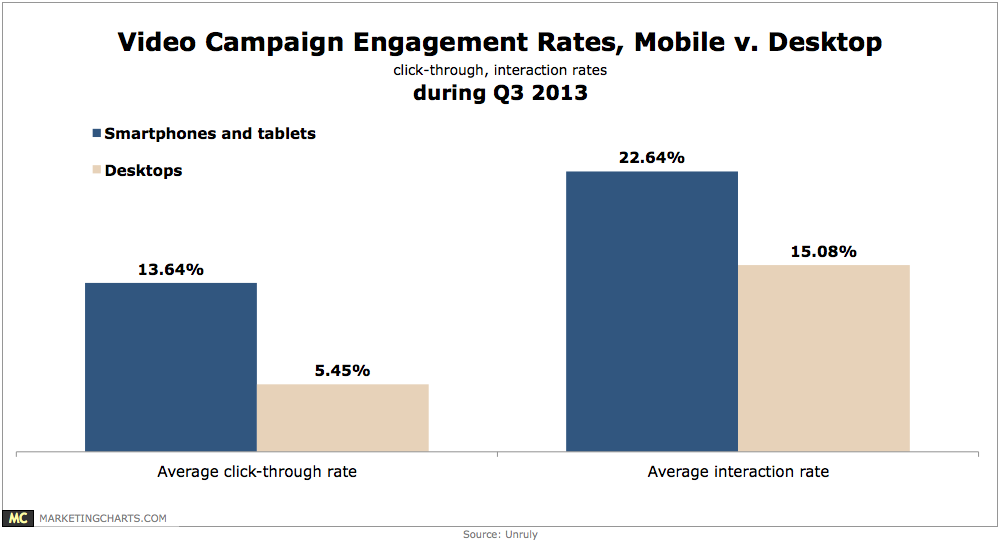
The average click-through rate (CTR) for video campaigns in Q3 was almost three times higher on smart phones and tablets (13.64%) than on desktops (5.45%).
Read MoreHighest-Priced Primetime Broadcast TV Programs, October 2013 [CHART]
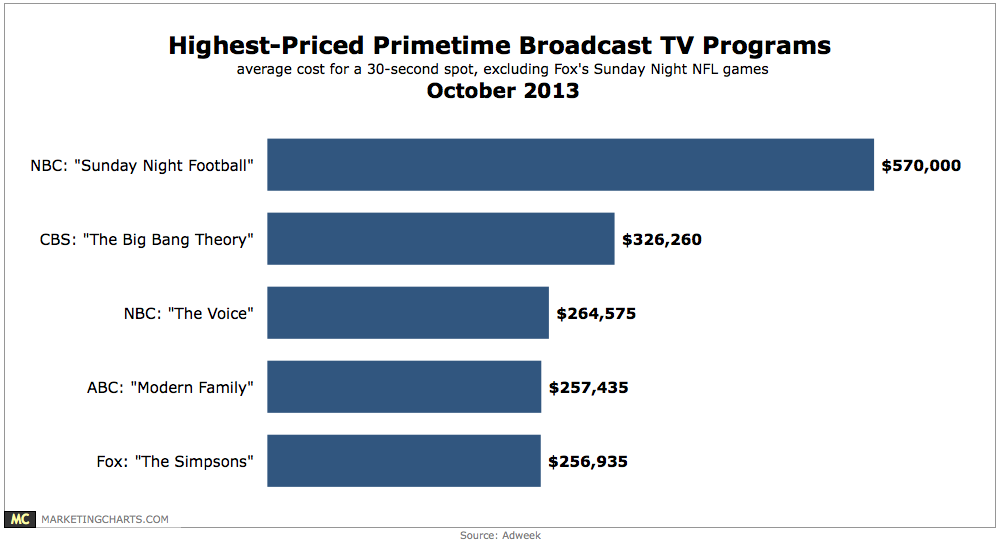
Advertising on Sunday Night Football costs about $570,000 for a 30-second spot in NBC’s games and $595,000 for Fox’s slate of late games,
Read MoreTravel Ad Spending Outlook By Media, Fall 2012 & Spring 2013 [TABLE]
Travel in-stream video ads led all industries in 2012 with a 1.47% click-through rate.
Read MoreUS Travel & Leisure Search Advertising Click Share By Device, Q2 2012-Q2 2013 [CHART]
Tablet and smart phone click shares for paid search ads in the travel and leisure category have increased more than 60% between Q2 2012 and Q2 2013.
Read MoreTop Metrics Used To Measure Native Advertising, June 2013 [CHART]
The majority of US marketers used engagement to measure native advertising.
Read MoreMetrics Brand Marketers Want To Use To Measure Online Ad Spending, February 2013 [CHART]
90% of US brand marketers preferred to use at least some digital-specific metrics to quantify the value of their online investment.
Read MoreFacebook Advertising Key Performance Indicators [INFOGRAPHIC]
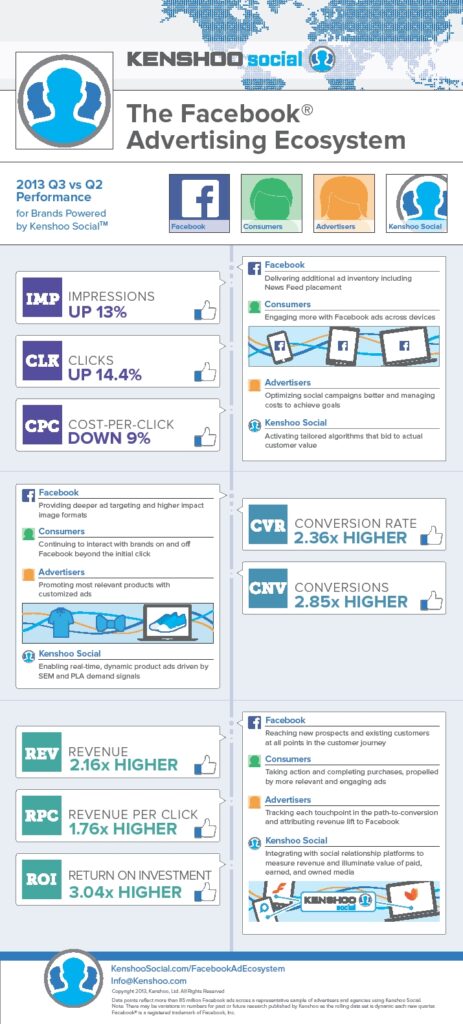
This infographic by Kenshoo Social (via AllFacebook) illustrates the key performance indicators for Facebook advertising for Q2 vs Q3 2013.
Read More