Ad Spending
US Online Ad Spending By Channel, 2012-2018 [TABLE]
Strong, steady growth in mobile advertising will push digital ads to represent nearly 30% of all US ad spending this year.
Read MoreTotal US Ad Spending Share By Media, 2012-2018 [TABLE]
US adults will spend an average of 2 hours 51 minutes per day with mobile devices this year.
Read MoreTotal US Ad Spending, 2012-2018 [CHART]
Total ad investments will jump 5.3% to reach $180.12 billion, achieving 5% growth for the first time since 2004, when ad spending increased 6.7%.
Read MoreChange In Ad Spending By Medium, Q1 2014 [CHART]
Total ad expenditures in Q1 grew by 5.7% year-over-year to $34.9 billion, boosted by the Winter Olympics, which added an incremental $600 million in spending.
Read MoreGerman Ad Spending By Media, 2010-2013 [TABLE]
German ad spending is expected to rise 2% in 2014.
Read MoreUS Ad Spend Growth By Medium, 2013 vs 2014 [CHART]
Digital media advertising grew to be larger than national TV ad spend last year.
Read MoreProgrammatic Display Ad Spending Worldwide, 2017 [CHART]
It is estimated that 60% of display ad spending in the Netherlands would be programmatic by 2017.
Read MoreUS Online Video Ad Spending Forecast, Desktop vs Mobile, 2014-2018 [CHART]
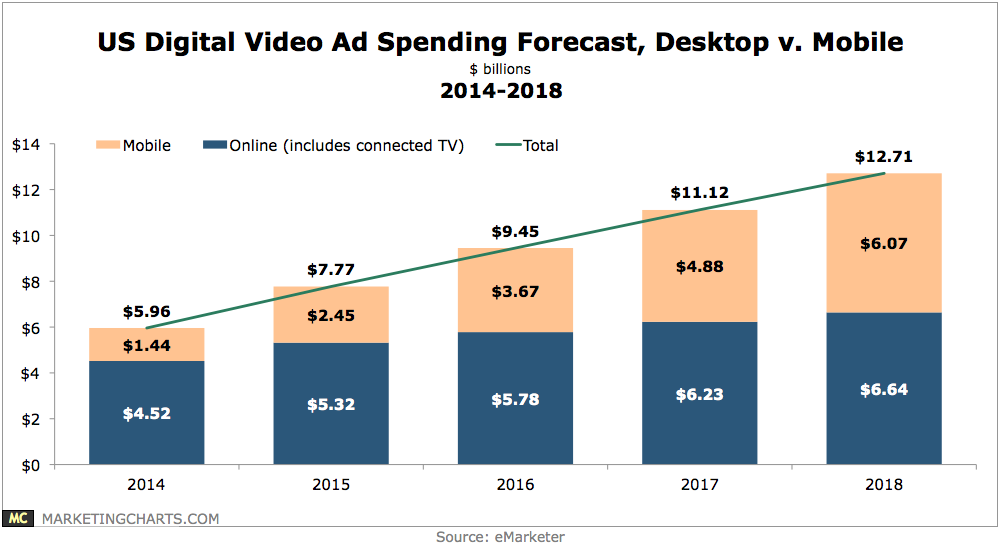
Marketers will spend more than $1.4 billion on mobile video ads this year, or close to one-quarter of total digital video ad spending.
Read MoreUS Online Video Ad Spending By Device, 2012-2018 [CHART]
Online video remains well ahead of ad investments in video programming on smartphones and tablets—for the time being.
Read MoreUS TV vs. Online Ad Spending Increases, 2012-2018 [CHART]
Despite digital video’s astronomical rise percentagewise, eMarketer projects that TV will add more new dollars this year.
Read More