Ad Spending
US Mobile Ad Spending, Local vs National, 2014-2019 [CHART]
US local ad spending via mobile is expected to soar more than 54% in 2015, from $4.27 billion to $6.58 billion.
Read MoreUS TV Ad Spending, 2013-2018 [CHART]
Overall TV ad spending growth isn’t in line with Super Bowl dollars.
Read MoreSuper Bowl Ad Rates & Total Ad Revenues, 2005-2014 [TABLE]
Total ad revenues from Super Bowl 2014 reached $331.8 million—up nearly 14% from $292.0 million the year before.
Read MoreUS Social Media Ad Spending By Type, 2014-2019 [CHART]
US native social media ad spending is expected to reach $18.4 billion in 2019, over 240.7% more than the $5.4 billion estimated for 2014.
Read MoreUS Mobile Display Ad Spending, 2013-2018 [CHART]
On the whole, cost-per-thousand (CPM) averages in 2014 were on par or above 2013 rates.
Read MoreTop 5 Countries In Ad Spending, 2015 [TABLE]
Around the world, advertisers will spend $592.43 billion in 2015, an increase of 6.0% over 2014.
Read MoreChange In Ad Spend By Medium, Q1-Q3 2014 [CHART]
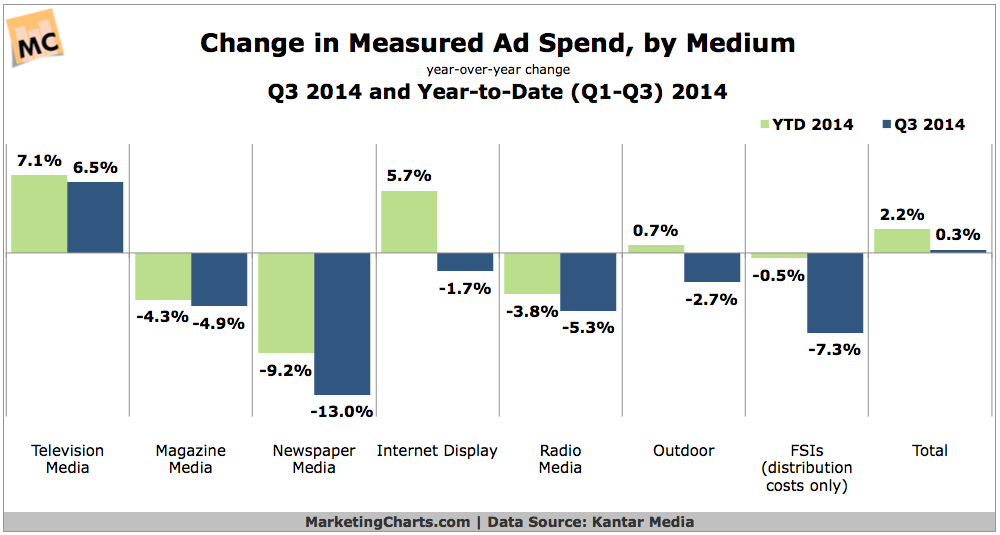
US ad spending grew by just 0.3% year-over-year in the third quarter to reach $33.7 billion, with year-to-date growth slowing to 2.2%.
Read MoreTop Drivers of Online Brand Ad Spending, December 2014 [CHART]
Marketers are shifting their digital campaigns from direct response to brand advertising.
Read MoreMedia Buyers' Top Priorities When Evaluating Native Advertising, May 2014 [CHART]
Among US media buyers polled in May 2014, 73% employed native advertising.
Read MoreTop Industries By African-American Media Spend, October 2014 [TABLE]
African-Americans represent 14.4% of the American population, yet only 2.6% of major media advertising is spent on African-American media.
Read More