Ad Spending
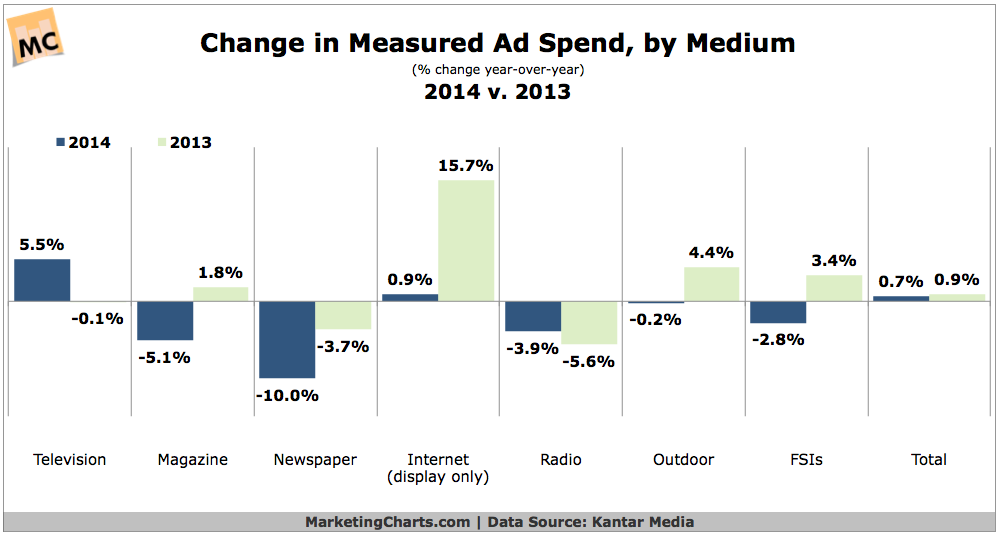
Change In Ad Spending By Medium, 2013 vs 2014 [CHART]
After growing by 0.9% in 2013, US advertising expenditures maintained a similar rate of growth of 0.7% in 2014 to reach $141.2 billion.
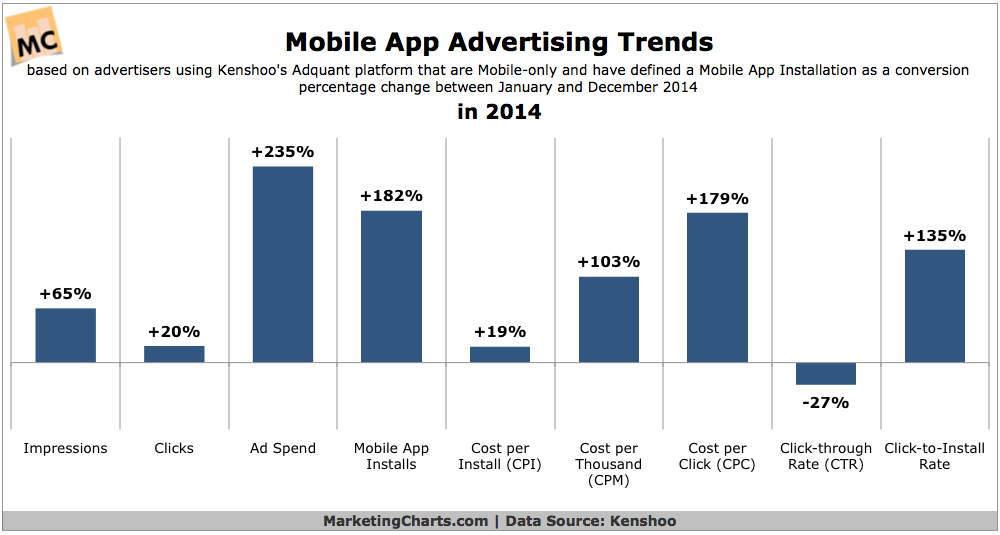
Read MoreMobile App Advertising Trends, 2014 [CHART]
Mobile application installs grew by 182% between January and December 2014, almost keeping pace with the growth in ad spending of 235%.
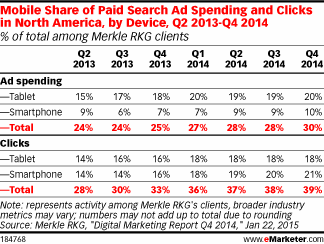
Read MoreMobile Share Of Search Ad Spending & Clicks, 2013-2014 [TABLE]
Mobile increased its share of paid search clicks by 6 percentage points in North America between Q4 2013 and Q4 2014, from one-third to nearly 40%.
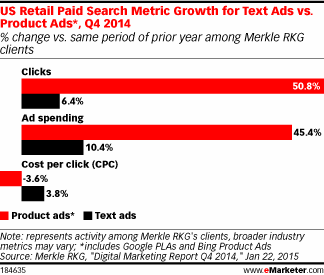
Read MoreUS Retailers Paid Search Metric Growth For Text vs Product Ads, Q4 2014 [CHART]
US retail paid search clicks for Product Listing Ads and Bing Product Ads combined rose 50.8% year over year in Q4 2014, vs. 6.4% for text ads.
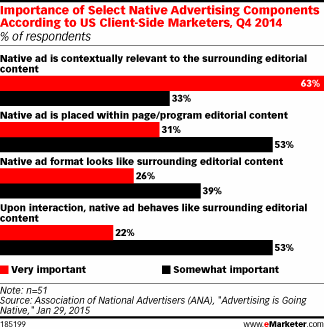
Read MoreImportance Of Select Native Ad Components, Q4 2014 [CHART]
BI Intelligence forecast that US native ad spending would rise by 35.4% in 2015, to $10.7 billion.
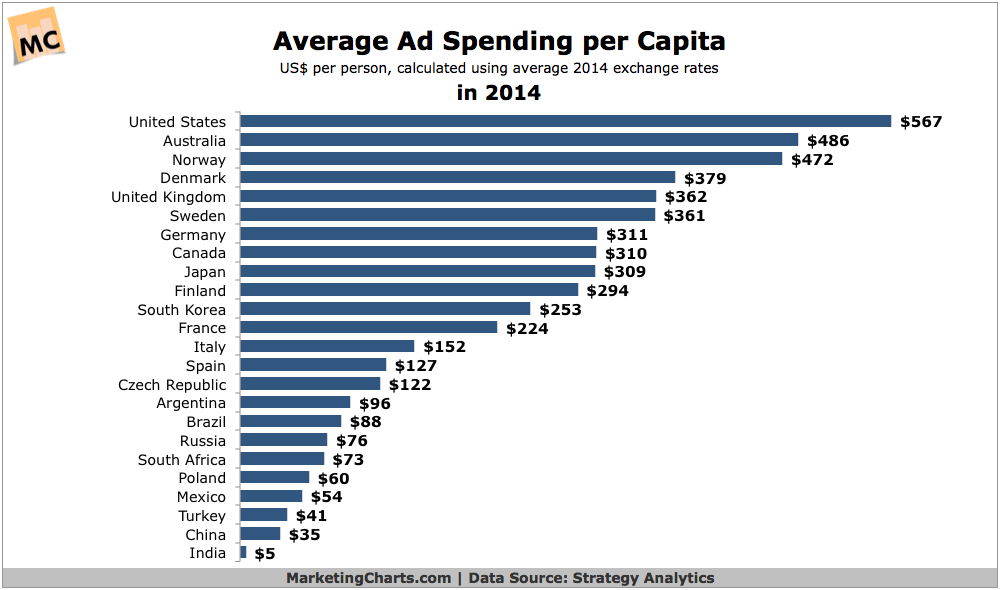
Read MoreGlobal Average Ad Spending Per Capita In 2014 [CHART]
Marketers spent an average of $567 advertising to each person in the US last year, according to Strategy Analytics’ calculations.
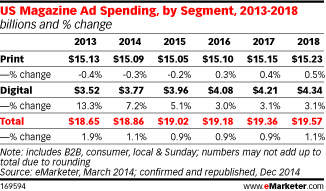
Read MoreUS Magazine Ad Spending By Segment, 2013-2018 [TABLE]
US advertisers will spend $19.02 billion on magazine ads in 2015, up just 0.9% from 2014.
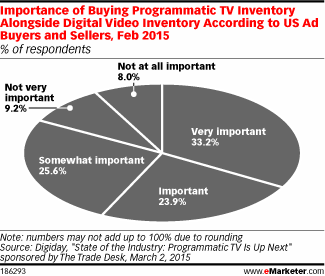
Read MoreImportance Of Buying Programmatic TV Ads & Video Ads, February 2015 [CHART]
67.1% purchased video programmatically, vs. 23.5% who said the same about TV.
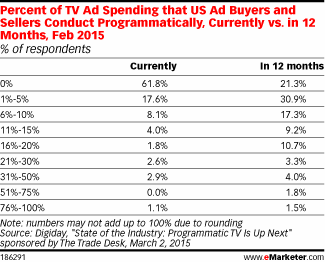
Read MoreState Of Programmatic Ad Spending Now & In 12 Months, February 2015 [TABLE]
Only 15% of US senior ad buyers reported using programmatic for TV ads.
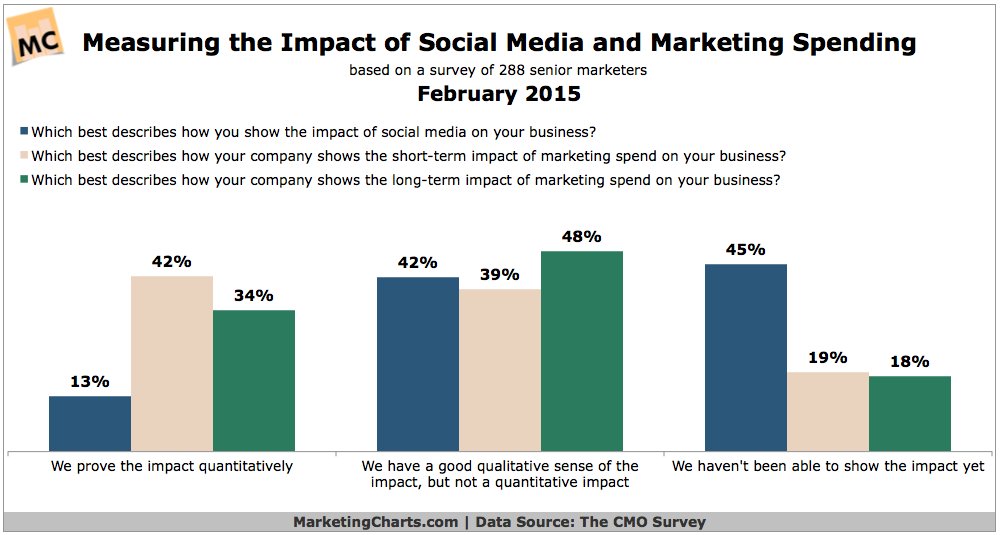
Read MoreSocial Media Marketing Impact & Spend, February 2015 [CHART]
Spending on social media continues to look up even as CMOs still struggle to prove its impact.
Read More