Ad Spending
US Mobile Search Ad Spending, 2011-2017 [CHART]

Desktop search volume declined for the first time, while the share of queries from smart phones and tablets reached roughly 20%.
Read MoreGlobal Ad Spending Growth In 2012 [CHART]
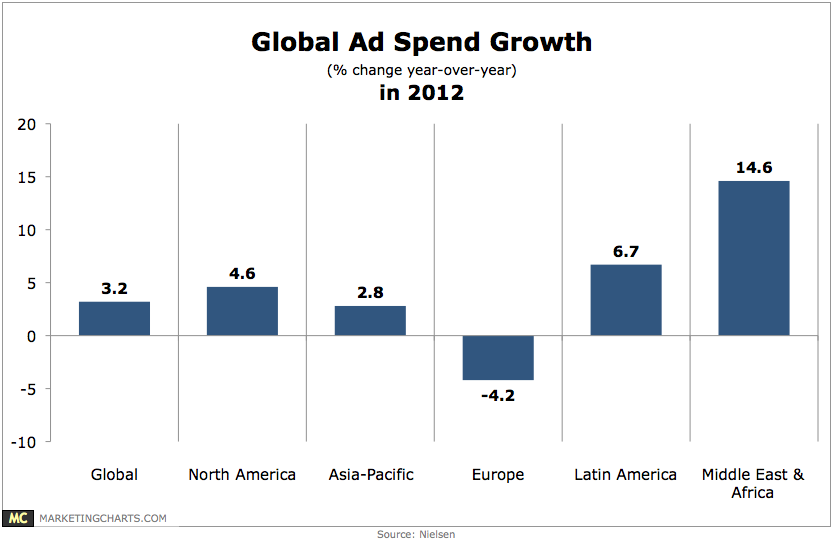
Worldwide advertising spending grew by 3.2% year-over-year in 2012 to reach $557 billion.
Read MoreUS Real-Time Bidding Display Ad Spending, 2011-2017 [CHART]
eMarketer estimates that total US RTB digital display ad spending will rise by 73% this year, after more than doubling in 2011 and nearly doubling again in 2012.
Read MoreGlobal Ad Spending Growth Forecast For 2013 By Country [TABLE]
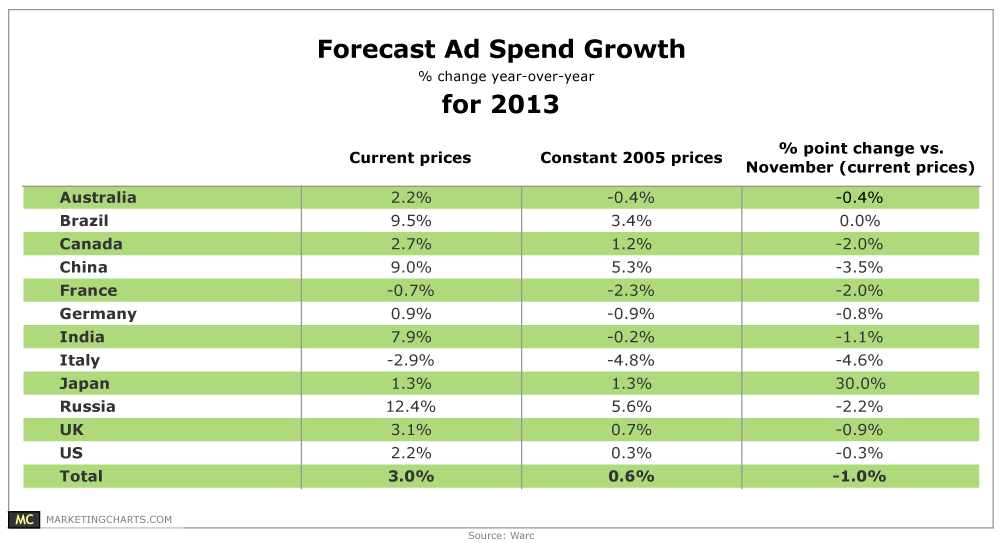
Global advertising spend (based on trends in 12 major markets) will increase by 3% this year and 5.4% next year.
Read MoreMobile Local Ad Spending, 2012-2017 [CHART]
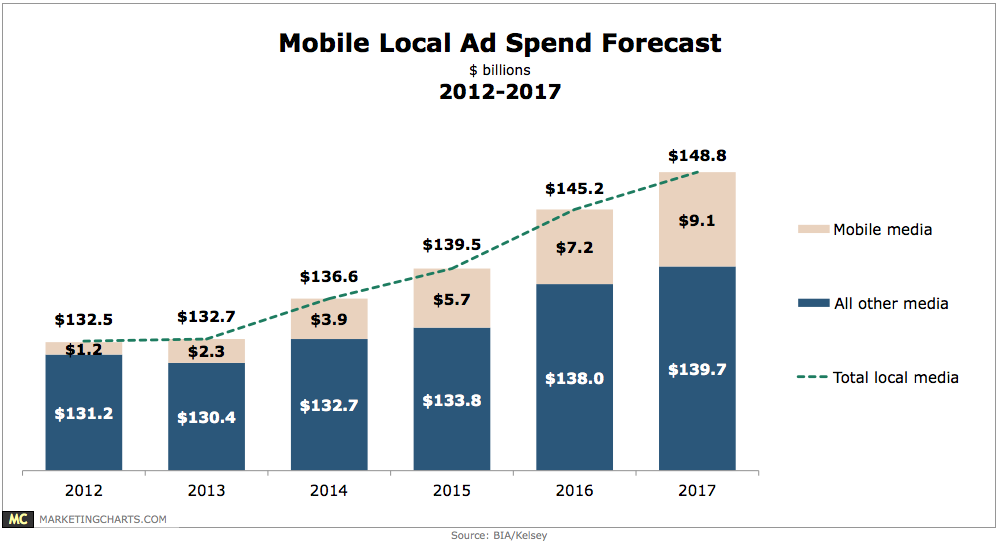
Increasing smart phone penetration and concurrent increases in ad inventory should spur 49.3% annual growth in local mobile ad spending through 2017.
Read MoreUS Mobile Ad Spending, 2011-2017 [CHART]
US mobile advertising spending grew 178% last year to $4.11 billion.
Read MoreUS TV vs Digital Video Ad Spending, 2011-2017 [CHART]
Spending on video ads served to PCs and mobile devices is expected to reach $4.14 billion this year, more than twice 2011 levels.
Read MoreUS Television vs. Online Ad Spending, 2011-2017 [CHART]
Advertisers will spend $66.35 billion on TV this year, up from $64.54 billion in 2012 and set to rise to over $75 billion by 2017.
Read MoreUS Television Ad Spending vs. Audience Growth, Q1 2011 – Q4 2012 [CHART]
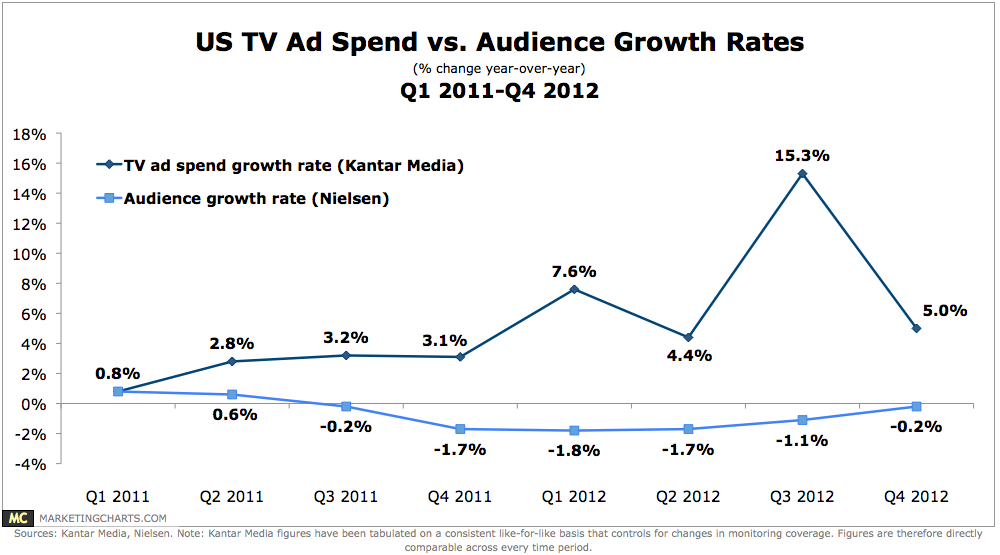
TV ad spending growth continues to be healthy even as its audience size declines.
Read MoreUS Television Ad Spending Growth vs. Overall Average, Q1 2011 – Q4 2012 [CHART]
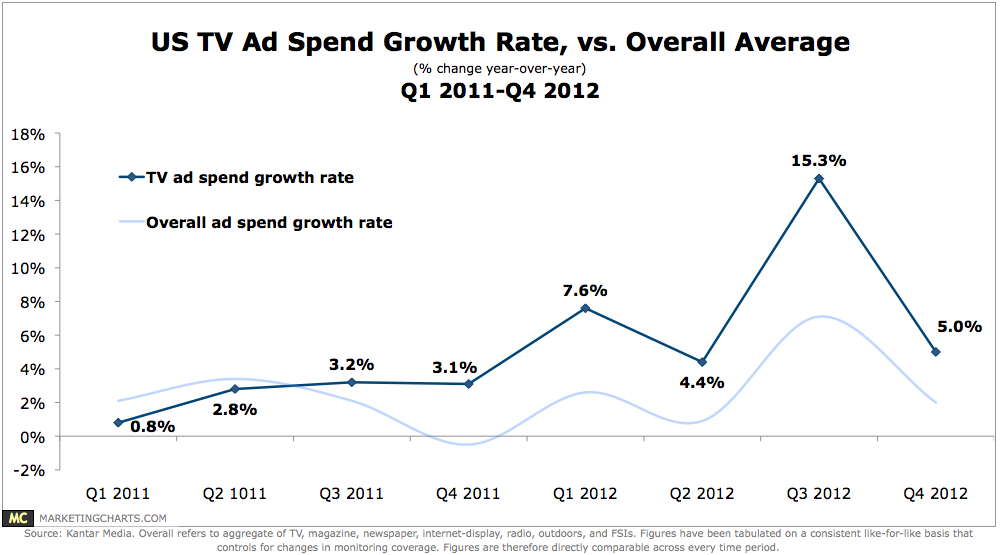
TV ad spending growth rates in the US continue to outpace the aggregate of all media.
Read More