Ad Spending
Financial Services Ad Spending By Objective, 2013 [CHART]
Marketers in the financial services industry will invest 62% of their paid digital dollars in direct-response efforts this year.
Read MoreFinancial Services Online Ad Spending, 2011-2017 [CHART]
Advertising spending in paid digital media by the US financial services industry will hit $5.20 billion in 2013 and rise to $7.38 billion by 2017.
Read MoreGlobal Ad Spending Forecast By Medium, 2012 vs 2013 [TABLE]
Warc believes that global expenditures will now increase by 3.4% as opposed to an initial assessment of 4% growth made in January.
Read More10 Fastest-Growing Advertisers In 2012 [CHART]
Ad Age identifies the fastest-growing spenders in 2012, each increasing their ad dollars last year by more than 25%.
Read MoreTop 10 American Advertisers In Q1 2013 [CHART]
The top 10 US advertisers accounted for an estimated $3.74 billion in ad spending excluding online advertising, or more than 10% of such spending in Q1.
Read MoreGlobal Online Ad Spending Forecast By Format, 2013 [CHART]
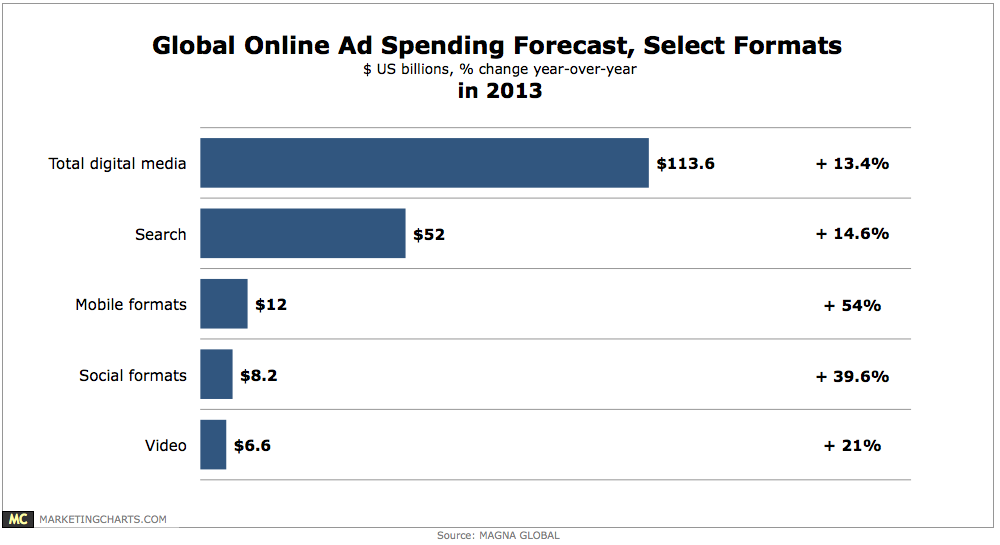
Online ad spending around the world is projected to grow by 13.4% to reach $113.6 billion this year.
Read MoreFactors Influencing Digital Video Spending, April 2013 [CHART]
73% of respondents saying better targeting would affect how much more they would spend on digital video.
Read MoreUS Online Sponsorship Ad Spending, 2011-2017 [CHART]
eMarketer estimates sponsorship spending in the US will rise 22.1% this year, from $1.54 billion in 2012 to $1.88 billion.
Read MoreUS Outdoor Ad Revenue Growth, Q2 2011 – Q1 2013 [CHART]
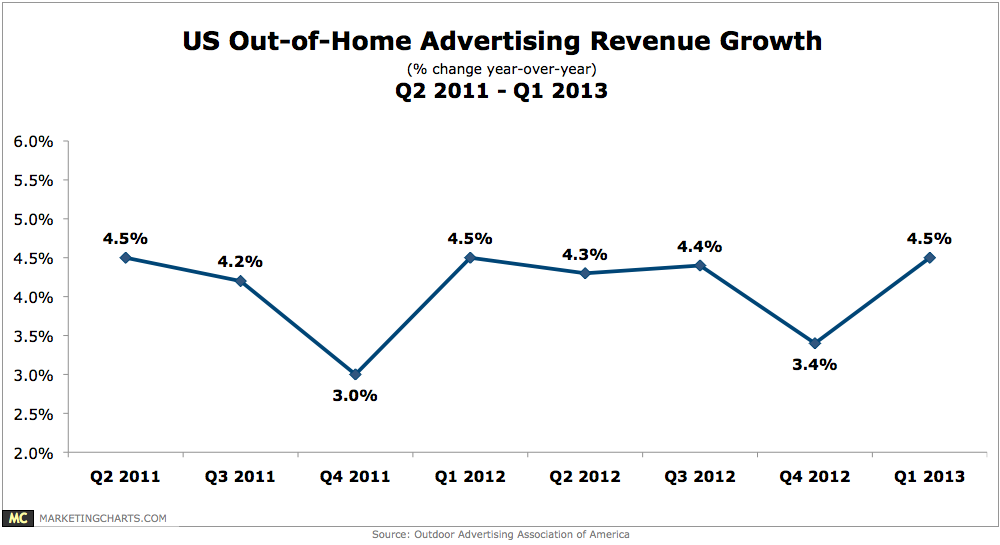
Outdoor ad spending was up 4.5% year-over-year in Q1, reaching $1.5 billion.
Read MoreAd Spending Share Of US Automobile Dealerships By Media, 2002-2012 [TABLE]
Dealers have dramatically increased their digital ad spending over the past decade, from just 5.0% of spending in 2002 to 26.5% in 2012.
Read More