Ad Spending
US Total Ad Spending By Media, 2011-2017 [TABLE]
eMarketer expects TV to continue to capture the largest share of paid ad spending in the US for the foreseeable future, though its percentage of total spending will drop slightly, from 39.1% in 2012 to 38.8% this year.
Read MoreUS Total Media Ad Spending, 2011-2017 [CHART]
eMarketer expects US advertisers to spend $171.01 billion on paid media this year, up 3.6% over 2012 spending levels.
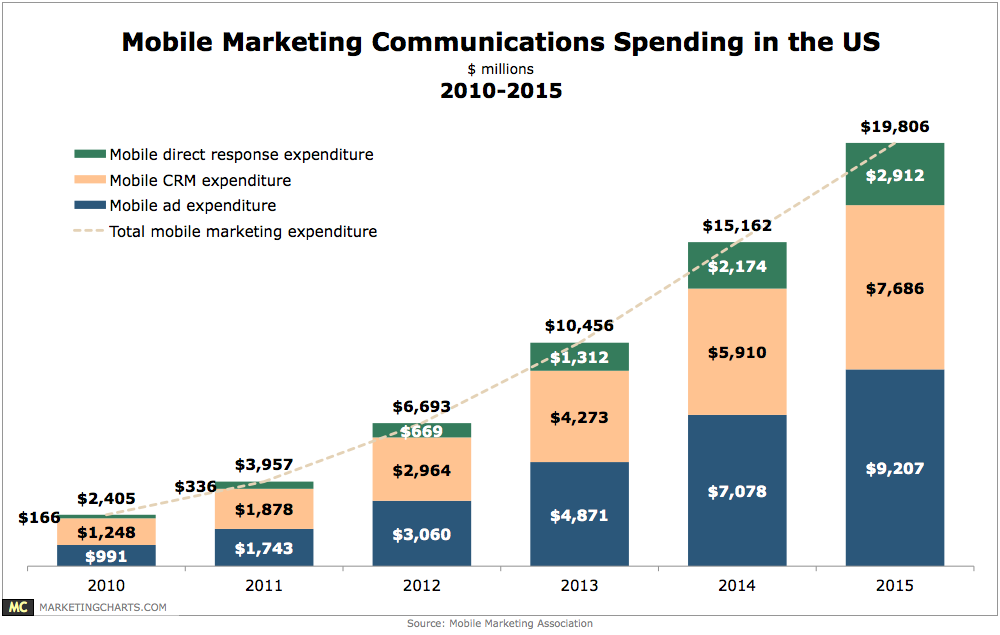
Read MoreUS Mobile Ad Spending, 2011-2017 [TABLE]
Mobile spending is expected to rise 95.0% this year to account for 20.1% of all digital ad spending, and 5.0% of total media ad spending.
Read MoreUS Digital Ad Spending, 2011-2017 [CHART]
US digital ad spending will hit $42.26 billion this year, up from $36.80 billion in 2012, to account for 24.7% of total media ad spending this year.
Read MoreUS Digital Ad Spending By Format, 2011-2017 [TABLE]
This year, 21.7% of all digital display ad spending will be on mobile, rising to 48.4% by 2017.
Read MoreUS Mobile Ad Spending By Format, 2011-2017 [TABLE]
In 2010, just 2.1% of all digital search ad dollars were spent on mobile devices. This year, that share will reach 22.1%.
Read MoreLikelihood Of TV Ad Spending Shifting To Online Video, June 2013 [CHART]
eMarketer expects US digital video ad spend to rise by 41.4% this year and by nearly 40% next year as well, when outlays will reach $5.7 billion.
Read MoreOnline Ad Spending Measurement Metrics, February 2013 [CHART]
Fifty-four percent said they would prefer to use the same metrics they use for offline campaigns, alongside additional metrics particular to online.
Read MoreChanges In B2B Marketing Spending During Next Year, March 2013 [TABLE]
45% B2B marketers expected to increase search engine advertising spending.
Read MoreChanges In B2B Ad Budgets, March 2013 [CHART]
29% of US marketers reported increasing their B2B advertising budgets over the preceding 12 months, while 59% said outlays had remained about the same.
Read More