Ad Spending
US Retail Online Ad Spending By Objective, 2013 [CHART]
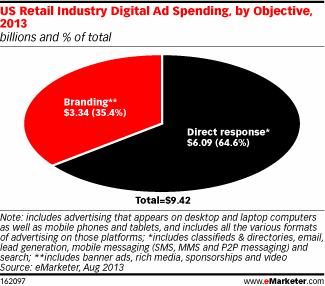
Retail marketers will invest 64.6% of their paid digital dollars in direct-response efforts this year.
Read MoreUS Online Ad Spending Share By Industry, 2011-2017 [TABLE]
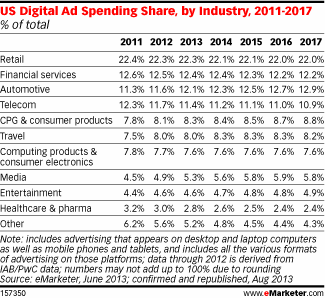
eMarketer expects the retail industry’s share of the total US digital advertising pie to decline slightly, from 22.3% in 2013 to 22.0% in 2017.
Read MoreUS Retail Online Ad Spending, 2011-2017 [CHART]
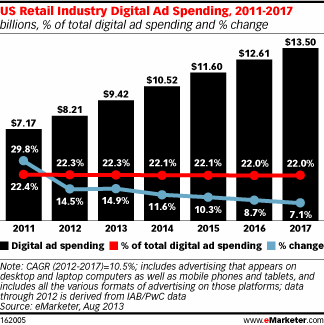
The US retail industry’s advertising spending on paid digital media will hit $9.42 billion in 2013 and rise to $13.50 billion by 2017, for a 10.5% compound annual growth rate.
Read MoreUS Online Display Ad Spending Share By Format, 2011-2017 [CHART]
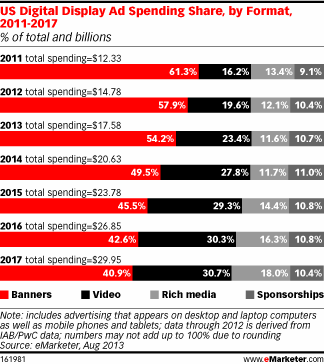
eMarketer estimates that video’s share of the overall digital display budget will rise from 23.4% this year to 30.7% by 2017.
Read MoreGlobal Ad Spending, 2011-2017 [CHART]
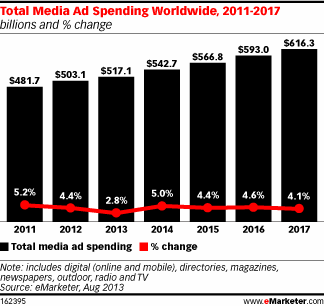
eMarketer predicts an increase of 2.8% in total media ad spending worldwide this year.
Read MoreGlobal Online Ad Spending By Region, 2011-2017 [TABLE]
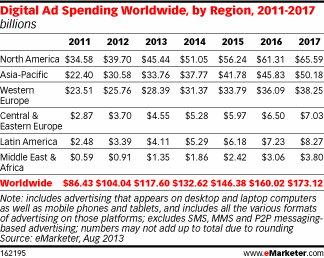
North America will remain the No. 1 digital ad market throughout the forecast period, with Asia-Pacific in second place.
Read MoreGlobal Mobile Ad Spending Share By Region, 2011-2017 [TABLE]

This year, eMarketer expects, 18.8% of all digital ad spending in North America will go toward mobile internet ads.
Read MoreUS Mobile & Online Ad Spending, 2012-2017 [CHART]
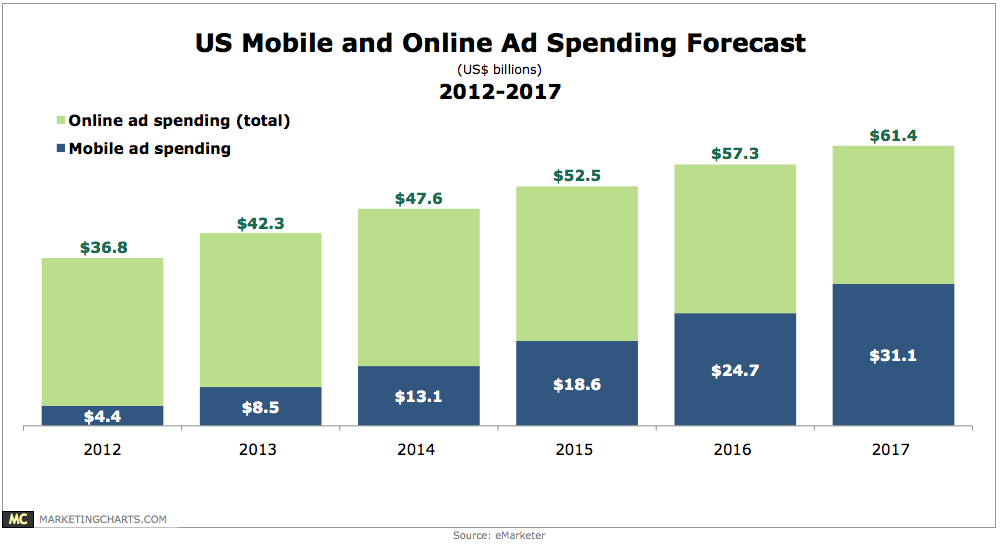
Mobile will capture a slight majority of US online ad spending in 2017.
Read MoreUS Mobile Display Ad Spending, 2011-2017 [CHART]
Mobile internet display ad spending will amount to $3.81 billion this year—up 21.7% from 2012.
Read MoreUS TV vs. Online Video Ad Spending, 2011-2017 [TABLE]
Even with the rapid rise of digital video viewership and ad spending, levels of spending on online and mobile video fall far below spending on TV.
Read More