Ad Spending
Global Mobile Ad Spending Growth By Industry, Q3 2013 [CHART]
The pharmaceutical industry has done the most to increase mobile ad spending as of Q3 2013.
Read MoreUS TV Ad Spending, 2011-2017 [CHART]
TV advertising expenditures are set to climb from $66.35 billion to $75.25 billion between 2013 and 2017.
Read MoreUS Total Media Ad Spending, 2011-2017 [CHART]
US total media ad spending will reach $171.33 billion in 2013, up 3.8%, or more than $6 billion, from 2012.
Read MoreUS Social Ad Revenue Forecast, Display vs Native 2012-2017 [CHART]
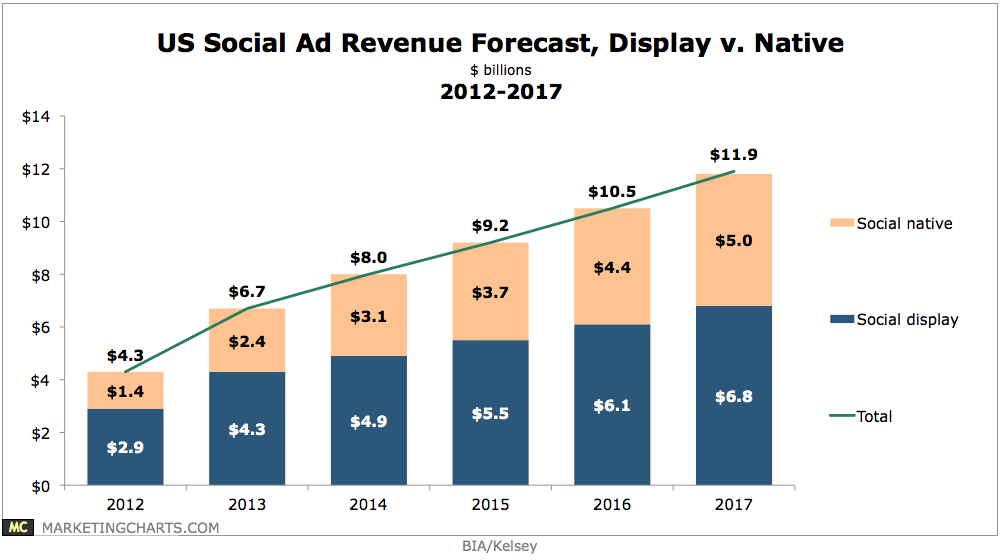
Native social ad revenues – primarily driven by Facebook’s Sponsored Stories and Twitter’s Promoted Tweets – will reach $5 billion in 2017, up from roughly $4.6 billion in the previous forecast.
Read MoreChange In Ad Spend By Medium, Q3 2013 [CHART]
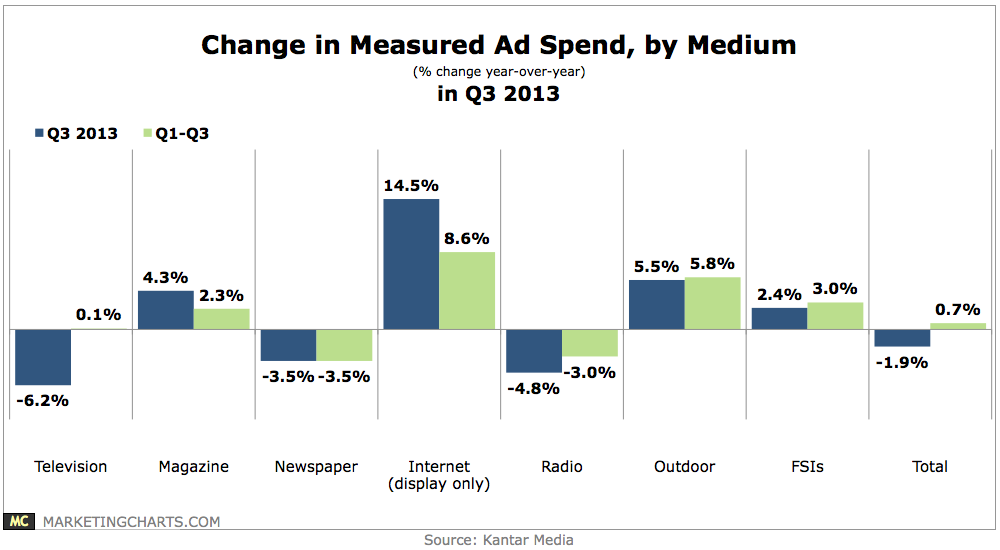
Total ad expenditures in Q3 were down 1.9% year-over-year, an unsurprising result given last year’s outlays on the Summer Olympics and political campaigns.
Read MoreMobile Ad Spending Growth By Vertical, Q3 2013 [CHART]
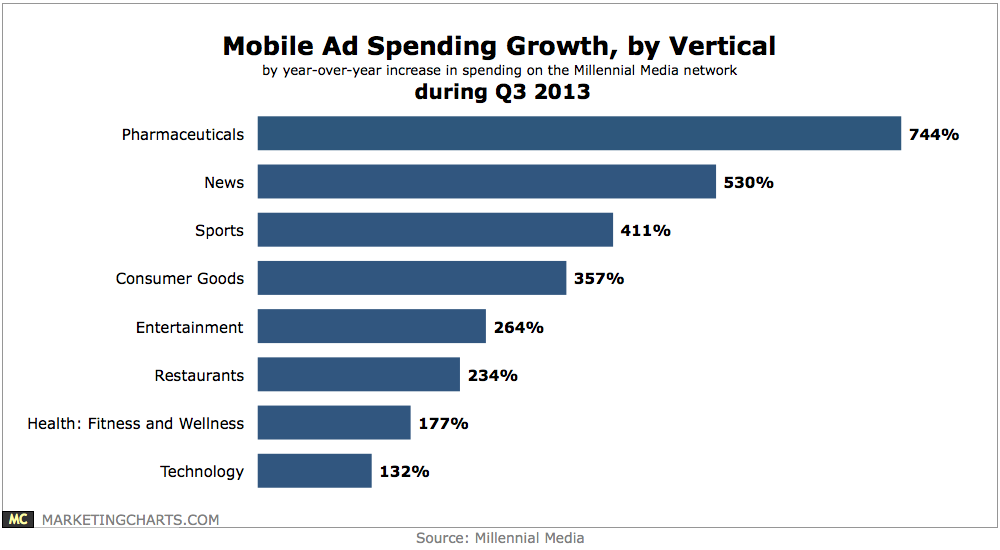
The pharmaceutical vertical leading the pack by virtue of an impressive 744% year-over-year increase in spending.
Read MoreUS Mobile Ad Spending Growth By Format, 2012-2017 [TABLE]
Virtually all the spending growth going to search, banners and rich media ad formats will go toward the mobile channel.
Read MoreUS Online Ad Spending By Channel, 2012-2017 [CHART]
US digital ad spending, including paid media spending on ads appearing on all digital devices, will increase 15.72% this year to $42.58 billion.
Read MoreGlobal Ad Spending Share By Medium, 2013 vs 2016 [CHART]
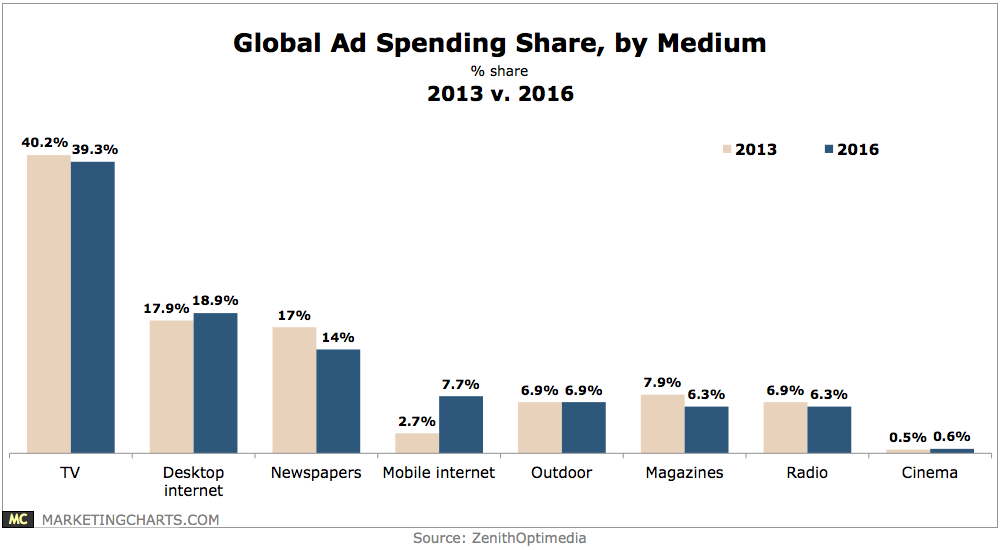
ZenithOptimedia predicts mobile advertising will generate more new ad spending ($31.8 billion) than TV ($29.8 billion) from this year through 2016.
Read MoreGlobal Social Media Ad Spending By Region, 2012-2015 [TABLE]
Social media ad spending will approach 12% in the US in 2014, and nearly 9% worldwide.
Read More