Ad Spending
Global Search Ad Spending Growth, Q4 2012-Q4 2013 [TABLE]
The growth rate for search ad spending in Asia-Pacific hit 28.58% in Q4 2013, making it the leader among all regions.
Read MoreLocal Ad Sales Forecast, 2013 vs 2014 [CHART]
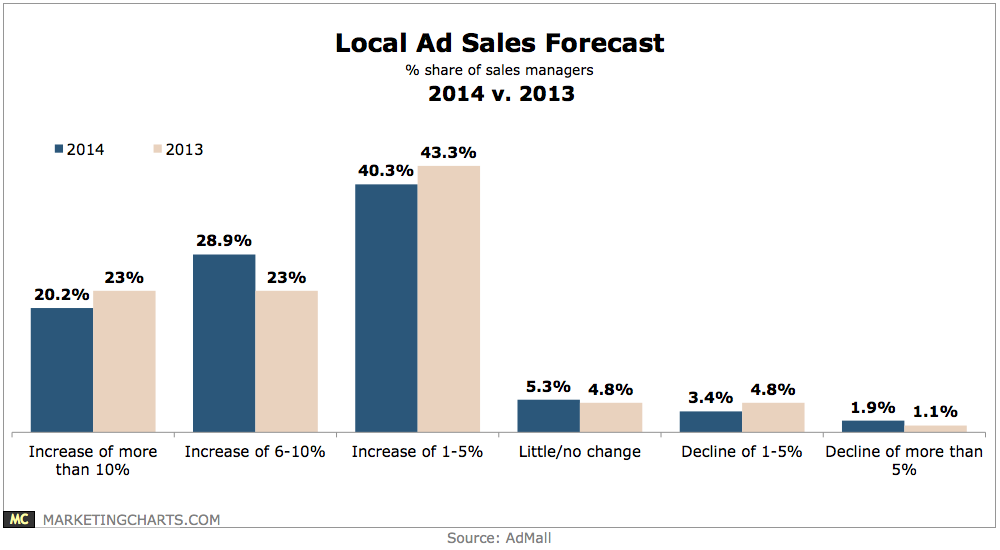
Roughly 1 in 2 executive and sales managers expect local ad revenue increases of more than 6% this year, including 20% who forecast gains in excess of 10%.
Read MoreGlobal Ad Spending Growth By Medium In 2014 [CHART]
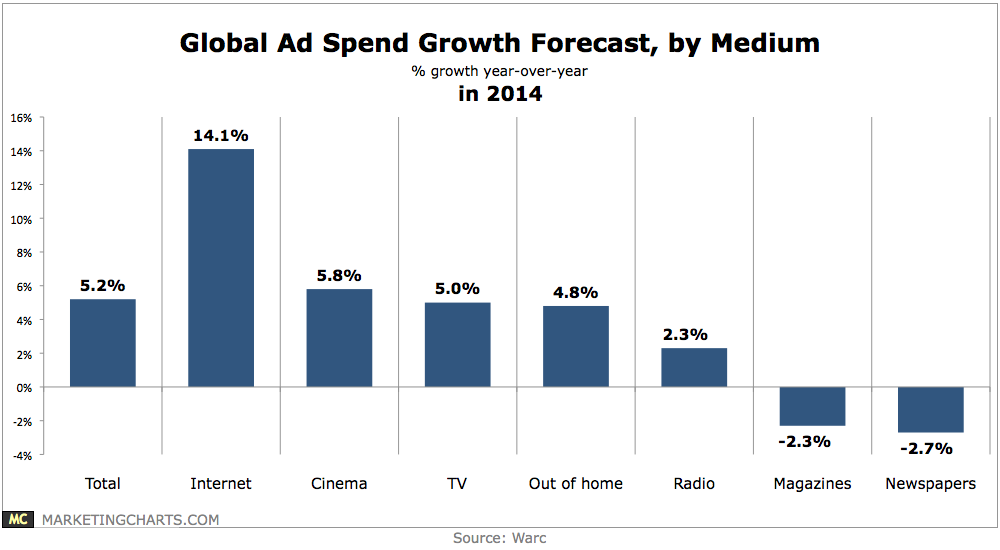
Global ad spending will increase by 5.2% this year, a significant uptick from the predicted growth of 3.2% for 2013, but a slight cut from a prior forecast of 5.4% growth.
Read MoreUS Restaurant Ad Spending, 2012-Q3 2013 [CHART]
Ad spending in the US restaurant industry slowed in Q3 2013, when year-over-year ad investments in the sector dipped by 3.6% to $1.58 billion.
Read MoreUS Mobile Search Advertising Growth By Device, Q4 2013 [CHART]
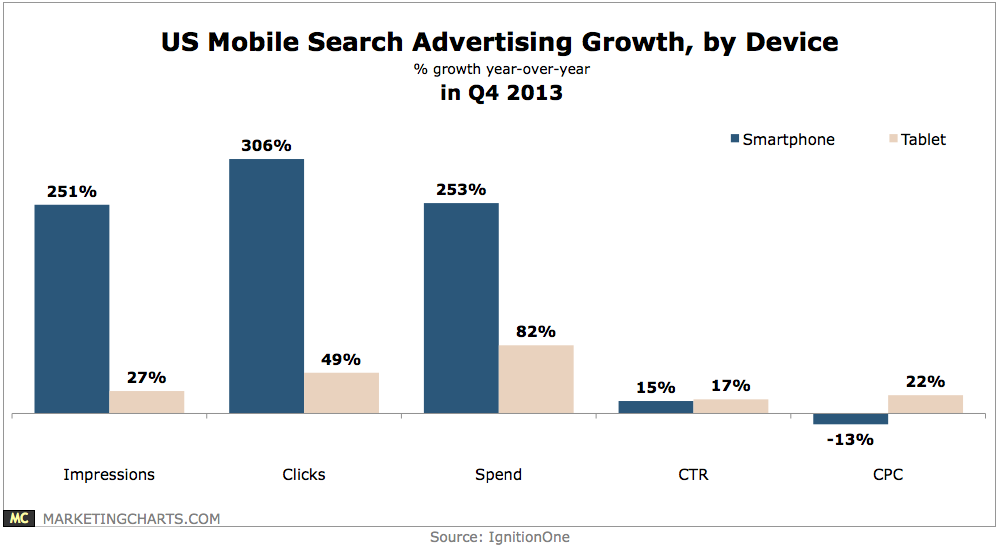
Search ad spending on smartphones soared by 253% year-over-year, while spending on tablets grew by a relatively smaller 82%, as advertisers’ targeting options were limited by Enhanced Campaigns.
Read MoreGlobal Social Network Ad Spending Growth By Region, 2012-2015 [TABLE]
Overall, social network ad spending is growing most quickly in the Middle East and Africa.
Read MoreGlobal Social Media Ad Spending Per Social Network User By Region, 2012-2015 [TABLE]
Advertisers will invest $32.82 on social network advertising per social network user in North America this year, up from just over $26 in 2013.
Read MoreUS Online Ad Spending Share By Industry & Objective, 2013 [TABLE]
Spending by some verticals—including travel and retail—skewed much more heavily toward direct-response advertising.
Read MoreUS Online Ad Spending Share By Industry, 2013 [CHART]
Between 2012 and 2017, investment in online and mobile paid media will increase from $36.80 billion to $62.83 billion, for a compound annual growth rate of 11.3%.
Read MoreGlobal Mobile Ad Spending, 2012-2017 [CHART]
The No. 1 goal of mobile ad campaigns worldwide in Q3 was to increase mobile traffic to a site, chosen by 34% of respondents.
Read More