Ad Spending
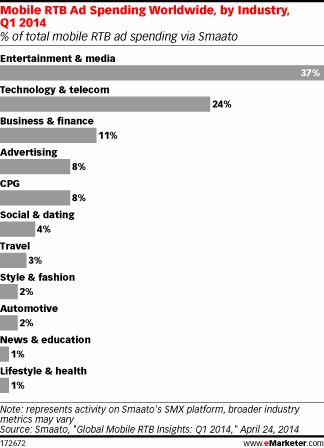
Global Mobile RTB Ad Spending By Industry, Q1 2014 [CHART]
eMarketer expects increases in US real-time bidding (RTB) digital display ad spending.
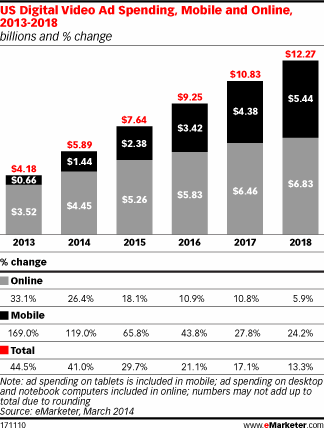
Read MoreUS Online Video Ad Spending, 2013-2018 [CHART]
Despite the growth of mobile video viewing and the relative stagnation of video viewing on PCs, ad spending still skews heavily toward online video.
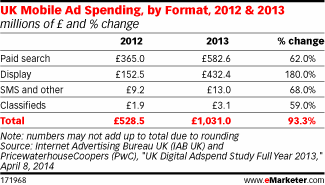
Read MoreUK Mobile Ad Spending By Format, 2012 & 2013 [TABLE]
Growth in display ad spending within the mobile space is even more pronounced than in the overall ad spend equation—IAB UK and PwC indicated an increase of 180.0% in the UK in 2013.
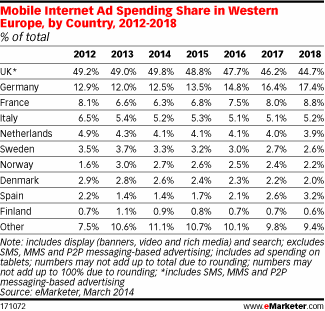
Read MoreWestern European Mobile Online Ad Spending Share By Share, 2012-2018 [TABLE]
UK mobile ad spending grew 126.1% in 2013 to account for 19.0% of all digital ad spending in the country; this proportion will increase to 31.9% in 2014.
Read MoreUK Online Ad Spending By Format, 2012 & 2013 [TABLE]
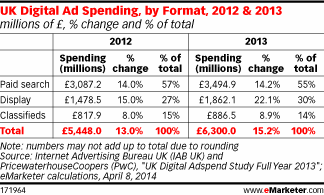
Total digital ad spend in 2013 rose by 15.2% to £6.30 billion ($9.84 billion), up from £5.45 billion ($8.51 billion) in 2012.
Read MoreAd Spending Growth In Western Europe By Country, 2012-2018 [TABLE]
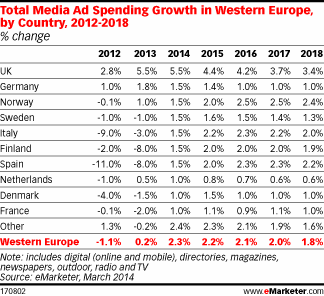
Total media ad spending in Sweden fell last year and amounted to no more than $3.77 billion, down from $3.80 billion in 2012.
Read MoreAd Spending In Sweden By Media, 2013 [TABLE]
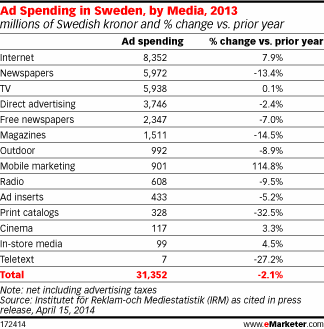
Ad spending on daily newspapers dropped 13.4%, and magazines saw a 14.5% decline.
Read MoreConsumption-Adjusted Ad Spend On Major Media, 2010-2014 [CHART]
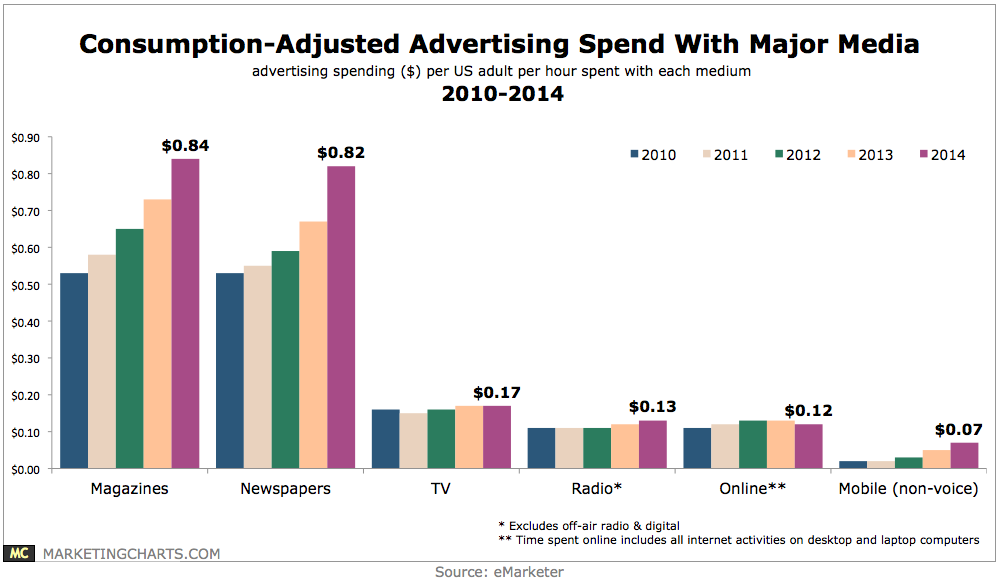
US advertisers are projected to spend 7 cents for every hour a US adult spends on connected mobile activities this year.
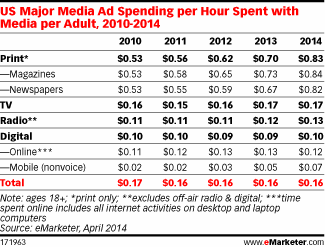
Read MoreUS Major Media Ad Spending Per Hour Spent With Media, 2010-2014 [TABLE]
Print still commands the most ad dollars—despite the fact that it’s losing in terms of absolute time spent with media at double-digit rates each year since at least 2011.
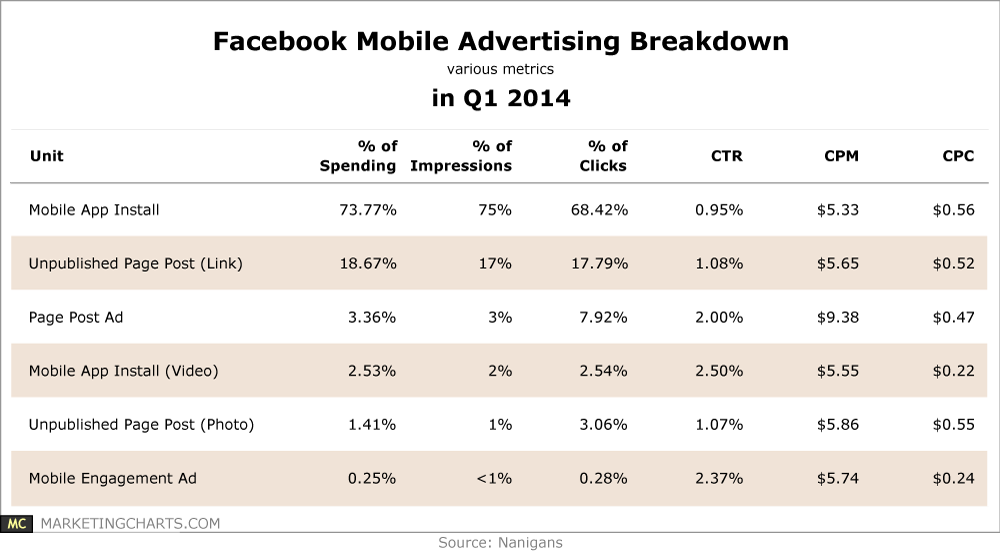
Read MoreFacebook Mobile Advertising Metrics, Q1 2014 [TABLE]
Almost three-quarters of Facebook mobile ad spending was directed at mobile application install ads in Q1.
Read More