Ad Spending
US Financial Services Online Ad Spending By Objective, 2014 [CHART]
In 2014, financial marketers will dedicate $3.84 billion, or 62% of their total digital ad spending, to direct response.
Read MoreUS Financial Services Online Ad Spending, 2012-2018 [CHART]
Advertising spending in paid digital media by the US financial services industry will hit $6.20 billion in 2014 and rise to $9.57 billion by 2018, for a five-year compound annual growth rate of 12.5%.
Read MoreUS Media & Entertainment Online Ad Spending By Objective, 2014 [CHART]
US media leans toward the direct-response side, with roughly a 60-40 split between direct response and branding.
Read MoreUS Media & Entertainment Online Ad Spending, 2012-2018 [CHART]
Digital advertising spending is expected to grow faster in media and entertainment than in other US industries.
Read MoreUS Online Ad Spending Estimates By Industry, May 2014 [CHART]
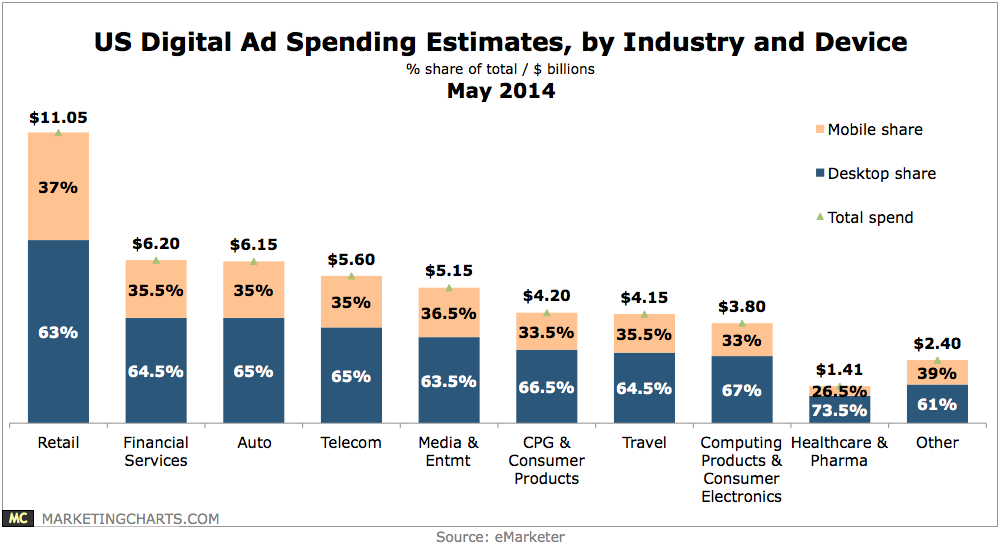
Mobile accounts for slightly more than 35% of digital ad budgets this year.
Read MoreUS Travel Industry Online Ad Spending By Channel, 2014 [CHART]
Mobile spending will make up 35.5% of the US travel sector’s $4.15 billion in digital ad investments in 2014 as travel marketers make changes to deal with high mobile device usage.
Read MoreUS Travel Industry Online Ad Spending By Objective, 2014 [CHART]
Nearly three-quarters of the US travel industry’s digital spending in 2014 will be devoted to direct-response objectives, as opposed to branding efforts.
Read MoreUS Travel Industry Online Ad Spending, 2012-2018 [CHART]
In 2014, the majority of the US travel industry’s digital ad spending will come from a handful of online travel agencies.
Read MoreUS CPG & Consumer Products Online Ad Spending By Channel, 2014 [CHART]

CPG’s share of spending on mobile is on the low end—just 7.9% of total mobile spending—compared with other industries such as retail, financial services and automotive.
Read MoreUS CPG & Consumer Products Online Ad Spending By Objective, 2014 [CHART]
US digital ad spending on branding will make up 65% of total budgets vs. 35% for direct response.
Read More