Ad Spending
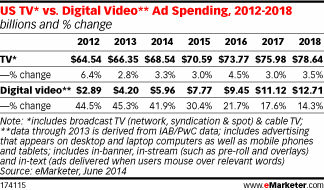
US TV vs. Online Video Ad Spending, 2012-2018 [TABLE]
Digital video advertising in the US is increasing at an eye-popping rate, but TV ad spending will still outpace digital video in dollar growth in 2014.
Read MoreMarketing & The 2014 World Cup [INFOGRAPHIC]
This infographic from Offerpop illustrates marketing efforts that are taking advantage of World Cup fever.
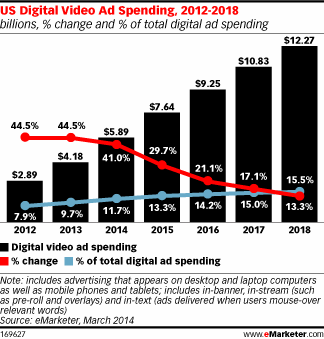
Read MoreUS Online Video Ad Spending, 2012-2018 [CHART]
Online video advertising will make up nearly 12% of all digital ad spending in the US this year.
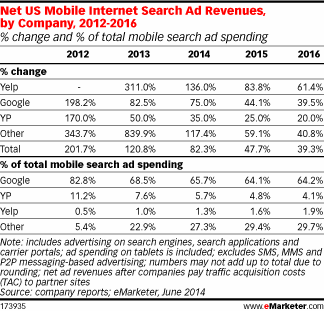
Read MoreUS Mobile Search Ad Revenues By Company, 2012-2016 [TABLE]
Google still dominates browser-based searches on mobile devices, but niche search apps are also becoming much more prevalent.
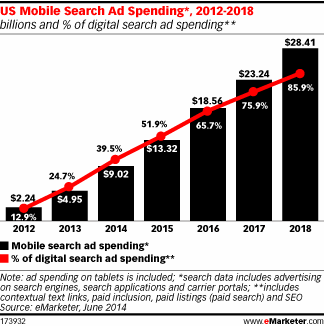
Read MoreUS Mobile Search Ad Spending, 2012-2018 [CHART]
Mobile advertising in the US will total $17.73 billion in 2014, with mobile search spending accounting for more than half of that total, or $9.02 billion.
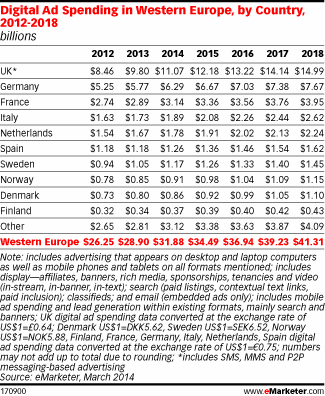
Read MoreWestern European Online Ad Spending By Country, 2012-2018 [TABLE]
Spending on display ads continued to gain momentum, logging higher growth than any other format, at 14.9%, and a total value of $12.27 billion.
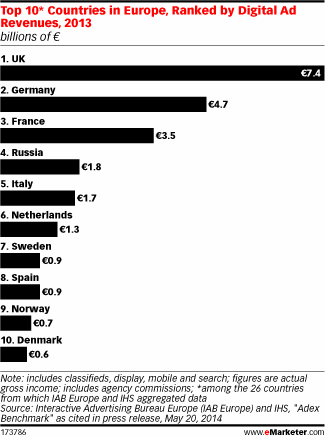
Read MoreTop 10 European Countries By Online Ad Revenues, 2013 [CHART]
Online advertising spending in Europe rose 11.9% last year to total $36.4 billion.
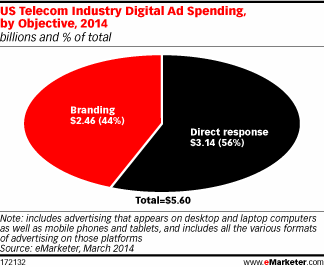
Read MoreUS Telecoms Online Ad Spending By Objective, 2014 [CHART]
Telecom is in line with US industry averages when it comes to the mix between direct-response and brand-driven advertising.
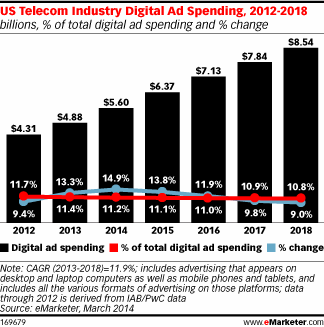
Read MoreUS Telecoms Online Ad Spending, 2012-2018 [CHART]
One of the reasons for telecom’s relatively slow growth curve is its reliance on search, which will lose share to video and rich media over the next several years.
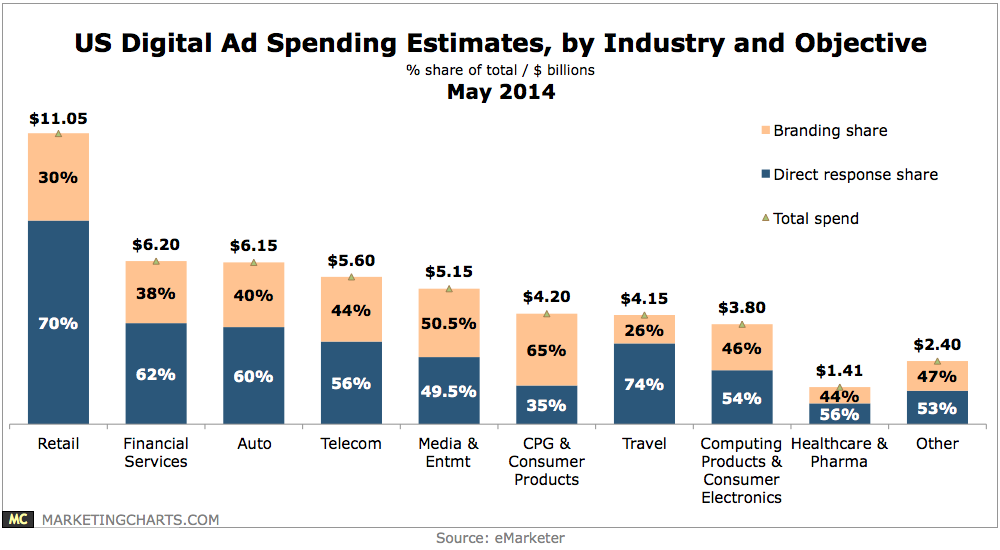
Read MoreOnline Ad Spending Estimates By Industry, May 2014 [CHART]
Almost 6 in every 10 dollars spent on digital ads this year have a direct response objective.
Read More