Posts by derickson
Top Advertising Channels [CHART]
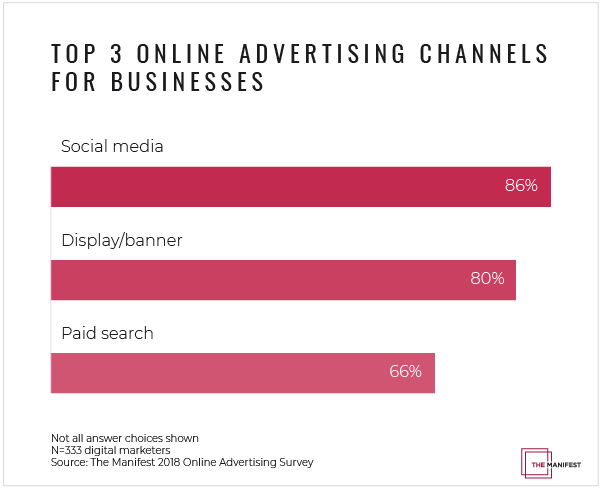
Eighty-six percent of businesses use social media advertising, while 80% use display advertising in the form of banner, image, or text advertisements that appear on websites.
Read MoreTrust In News Media [CHART]
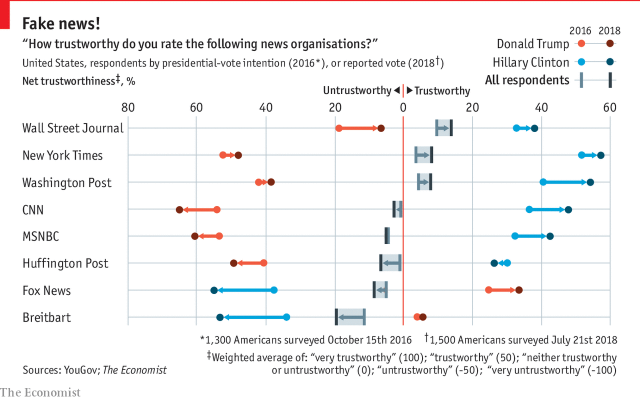
On behalf of The Economist, during the past three years YouGov, a pollster, has asked a representative sample of Americans to rate large American news organisations on a scale from “very trustworthy” to “very untrustworthy”.
Read MoreFacebook Video Interactions By Topic [CHART]
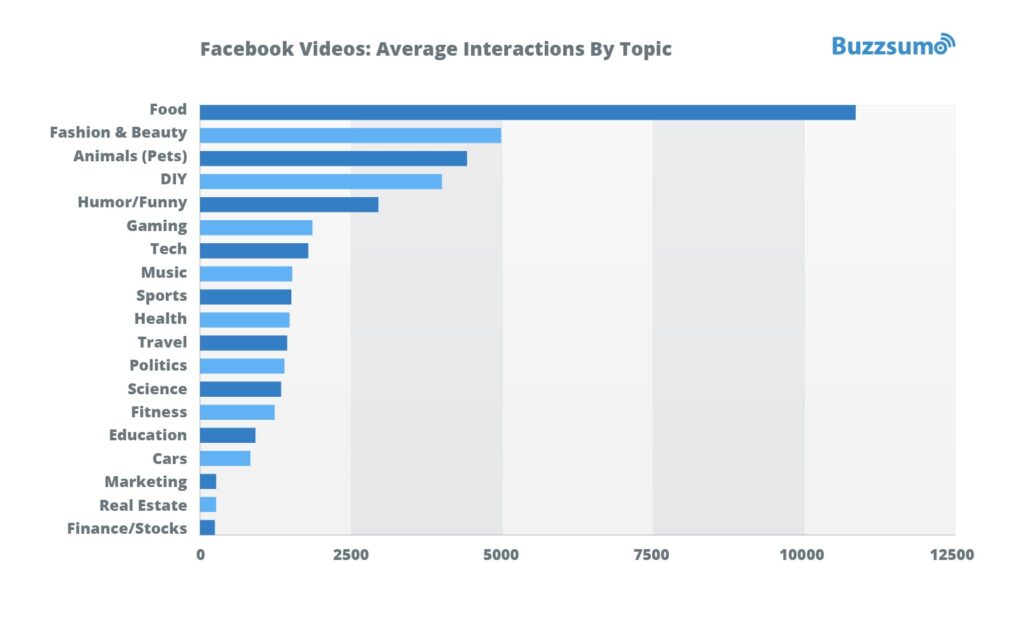
Buffer partnered with BuzzSumo to analyze more than 43 million posts from the top 20,000 brands on Facebook in one of the largest studies of 2018. The most enaging topics posted as video content to Facebook include food, fashion and beauty, animals, do-it-yourself, and humor. The least engaging topics include finance and stocks, real estate, marketing and cars.
Read MoreDecline Of Facebook Interactions, 2017-2018 [CHART]
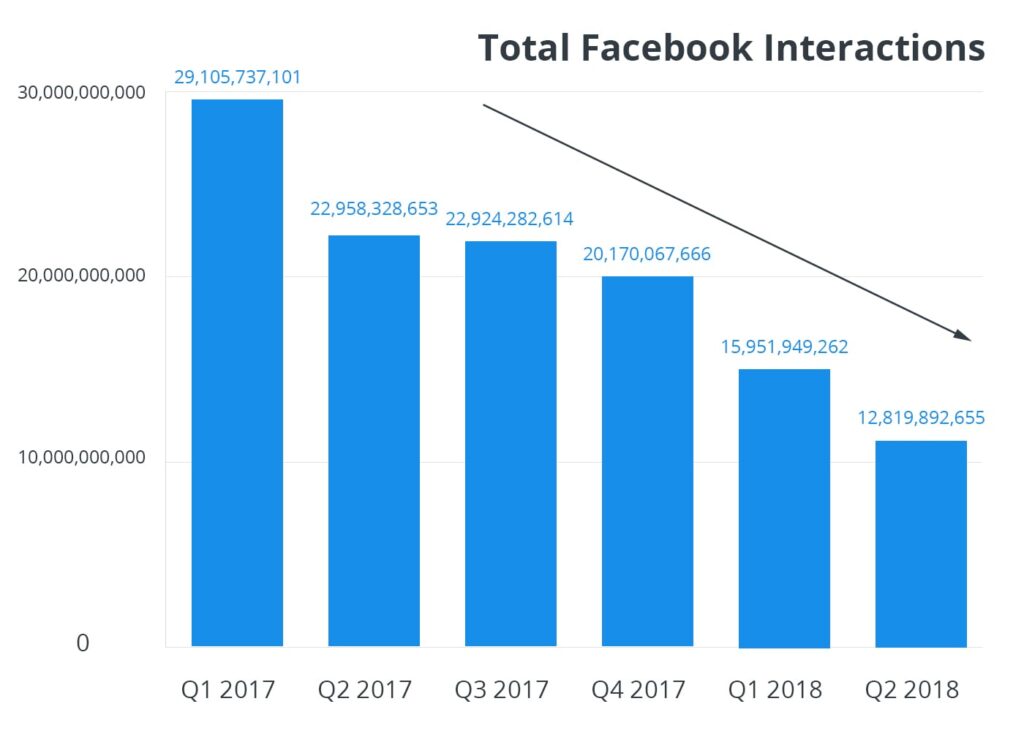
Naturally, if the world’s top Facebook Pages are posting an additional 20,000 pieces of content per day to the platform, there’s going to be an increase amount of competition in the News Feed and a decrease of engagement across the board.
Read MoreGoogle AdWords vs Facebook Ads [INFOGRAPHIC]
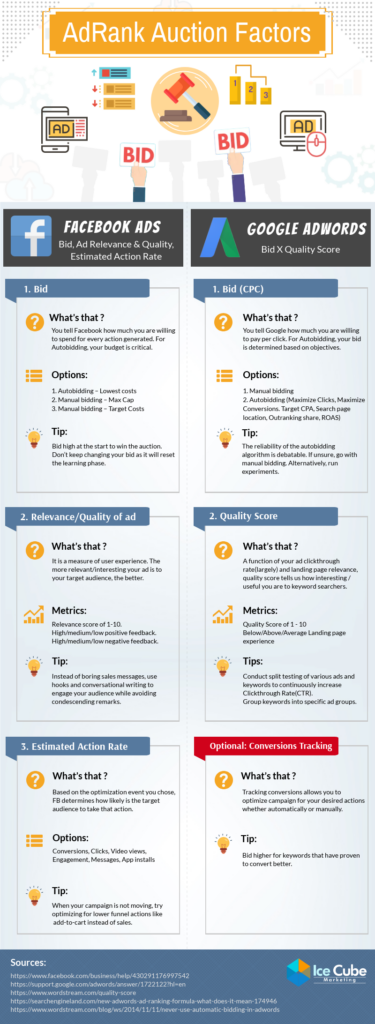
This infographic from Ice Cube illustrates the differences between Google AdWords auction system and the Facebook advertising auction system.
Read MoreElements Of Successful Websites [INFOGRAPHIC]

This infographic from Quicksprout illustrates 10 elements that contribute to a successful website.
Read MoreInvoluntary Churn Rates For Subscription Businesses
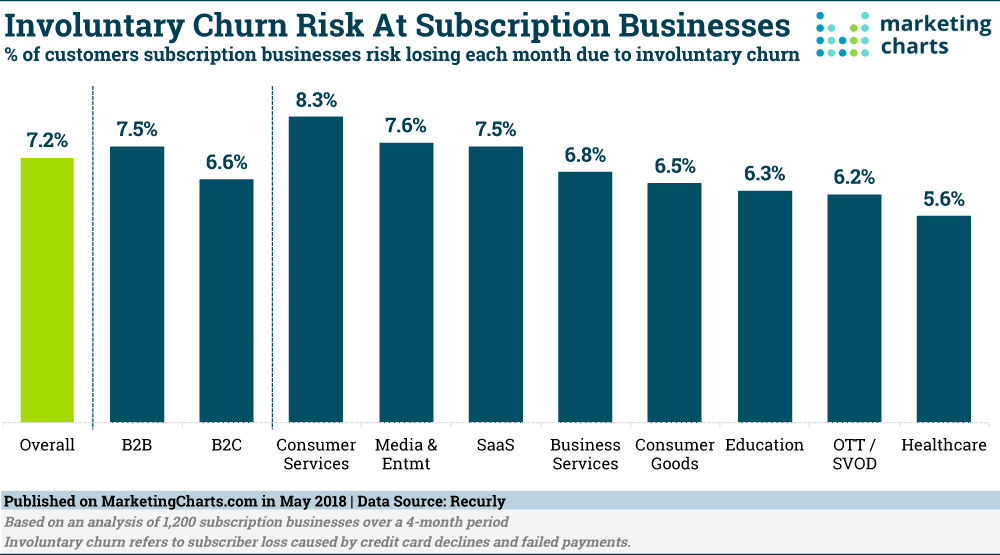
Keeping subscribers satisfied with products and services is one thing – but what about involuntary churn, such as through failed payments and credit card declines? Recurly dives into its data to provide some benchmarks.
Read MoreChallenges To Mobile Commerce
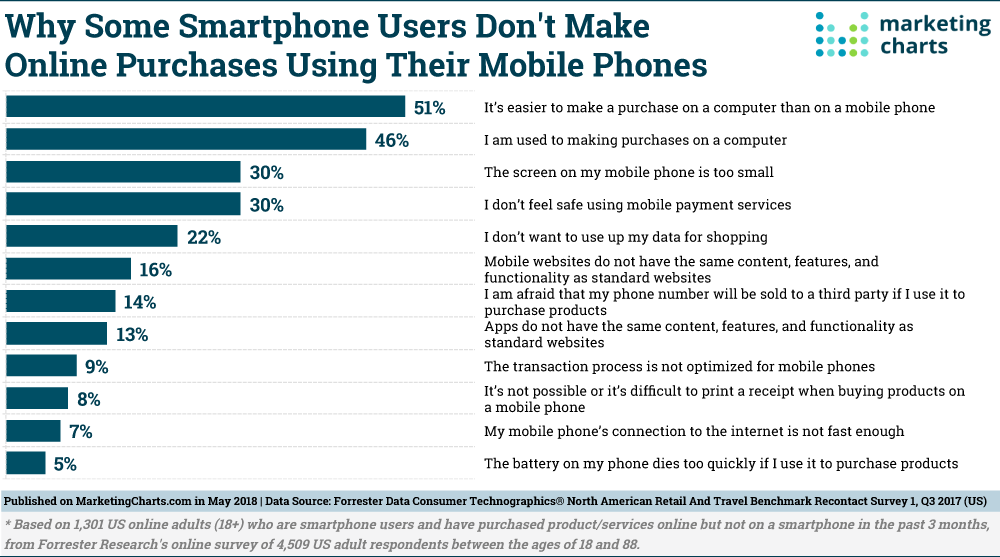
The percentage of e-commerce sales made using a mobile phone decreased last year. That’s according to a report from Forrester Research, which says that mobile phones accounted for 36% of online retail sales last year, down from 43% in 2016.
Read MoreAutomated Marketing Emails
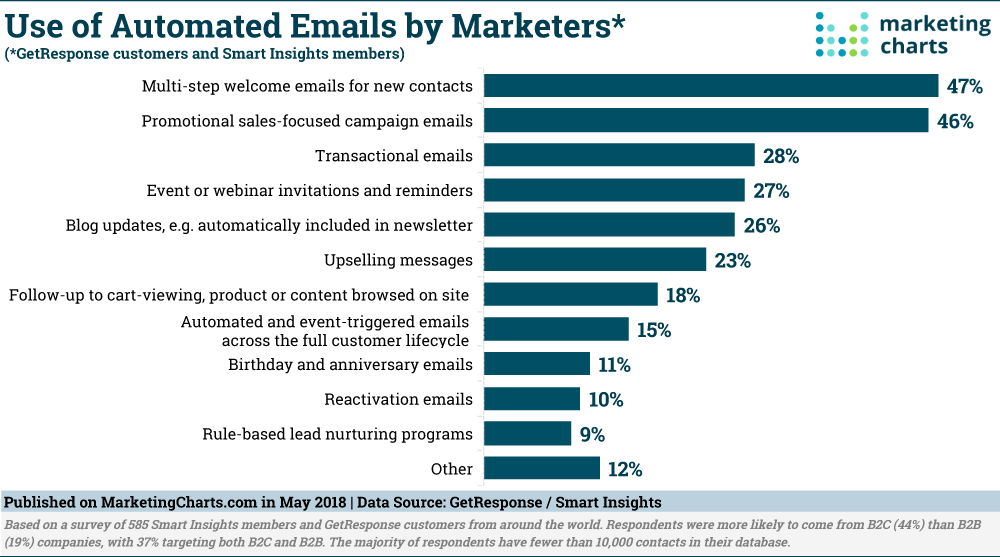
Just 1 in 5 marketers say they use most or all marketing automation features available to them, and even fewer (18%) consider themselves to be Advanced or an Expert.
Read MoreWebinar Conversion Rates
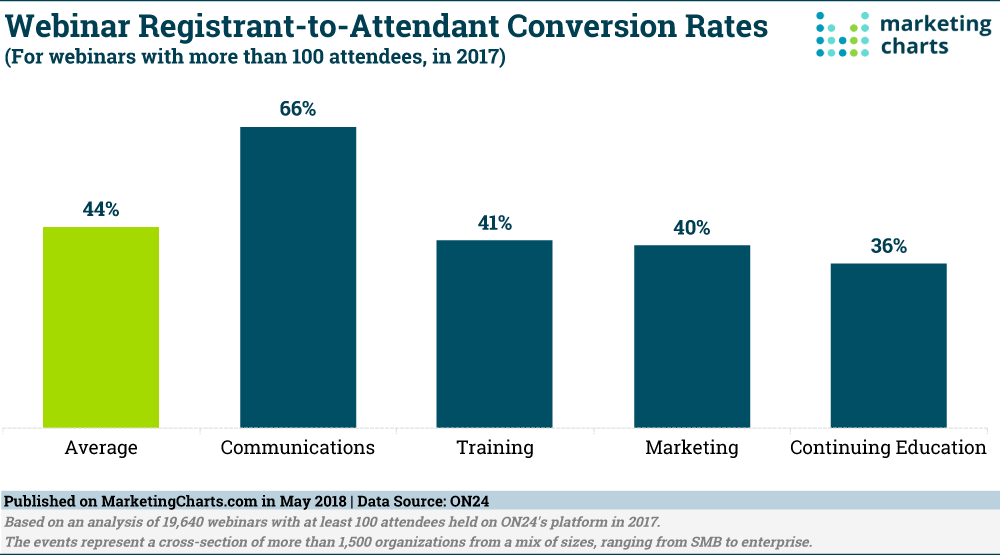
47% of registrants signed up for a webinar at least 8 days before the event, including about one-quarter (24%, up from 21% in 2016) signing up more than 2 weeks earlier.
Read More