Posts by derickson
Mobile Web Ads Ranked From Not-So-Horrible To Worst [CHART]
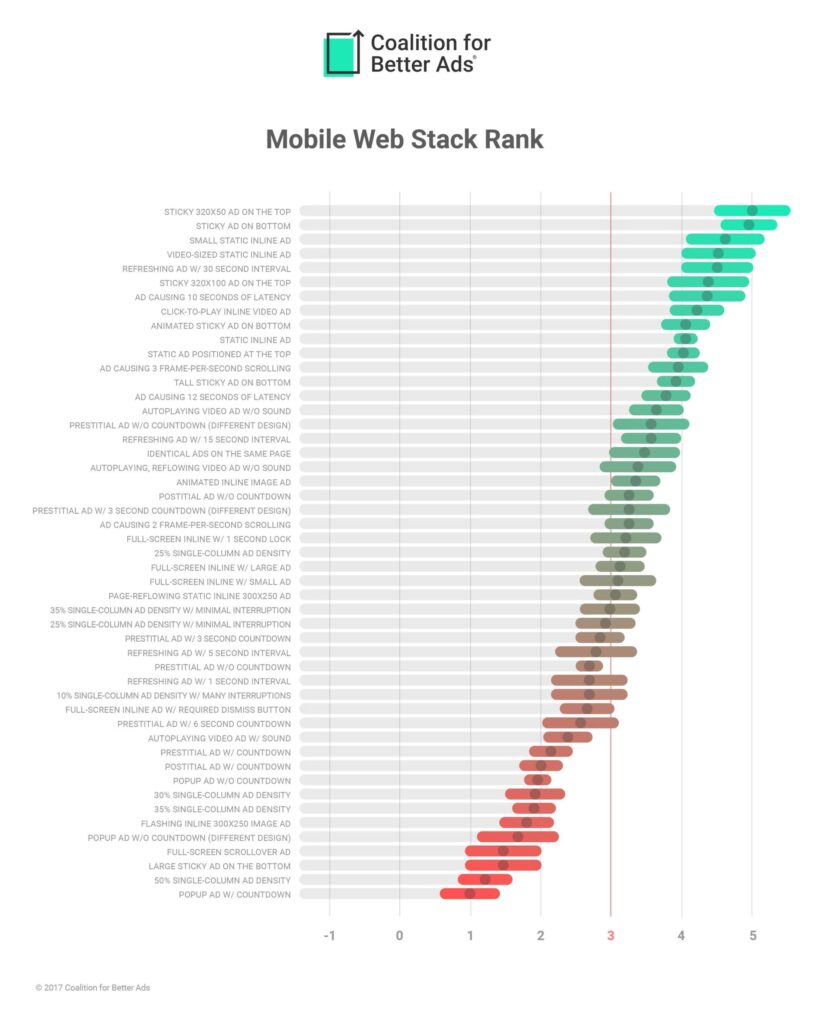
Based on surveys of 25,000 internet users in North America and Europe conducted by the Coalition (though namely by Google), roughly 85 percent of mobile users surveyed said they found anchor ads only a little annoying or not annoying at all.
Read MoreGoogle vs Facebook Referral Traffic, 2017 [CHART]
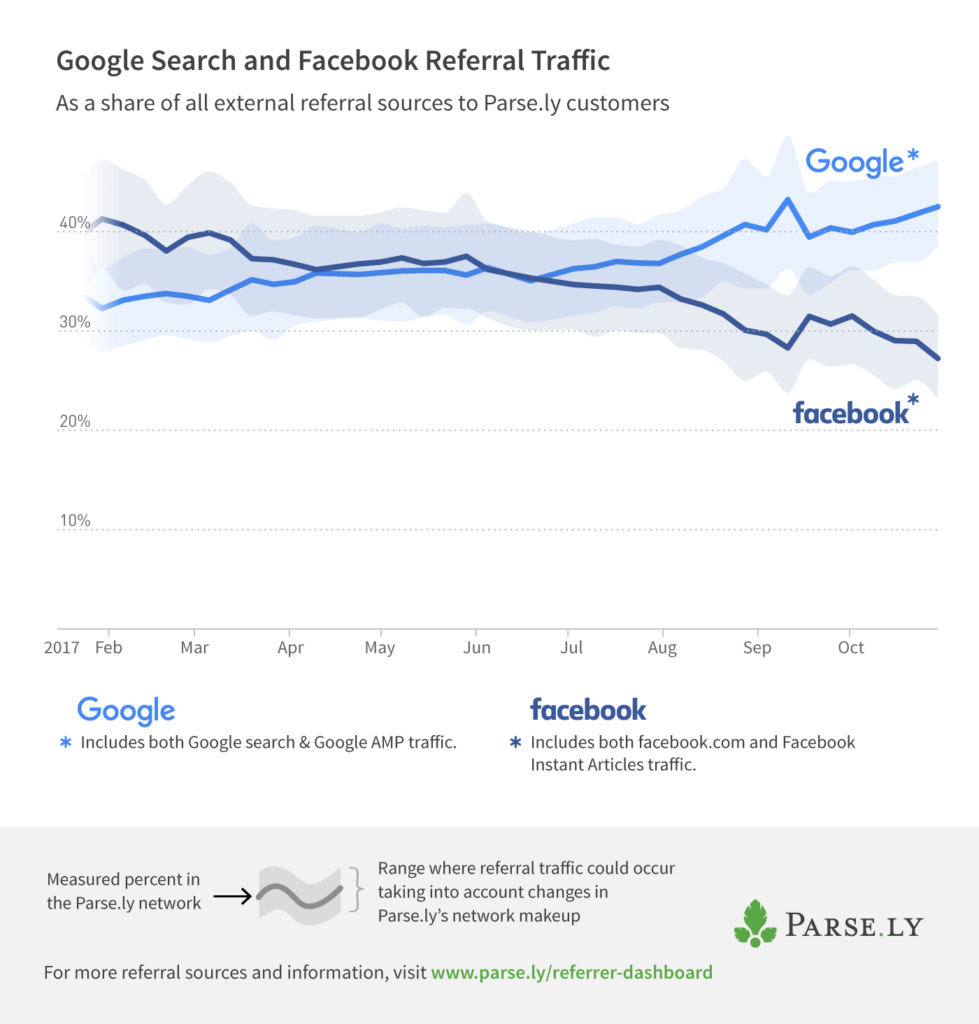
This Parse.ly data reflects the upward trend in referral traffic from Google (all – including AMP – Google’s Accelerated Mobile Pages format) and declining trend in referral traffic from Facebook specifically (all Facebook – including Instant Articles).
Read MoreSearch Engine vs Social Traffic, 2011-2017 [CHART]
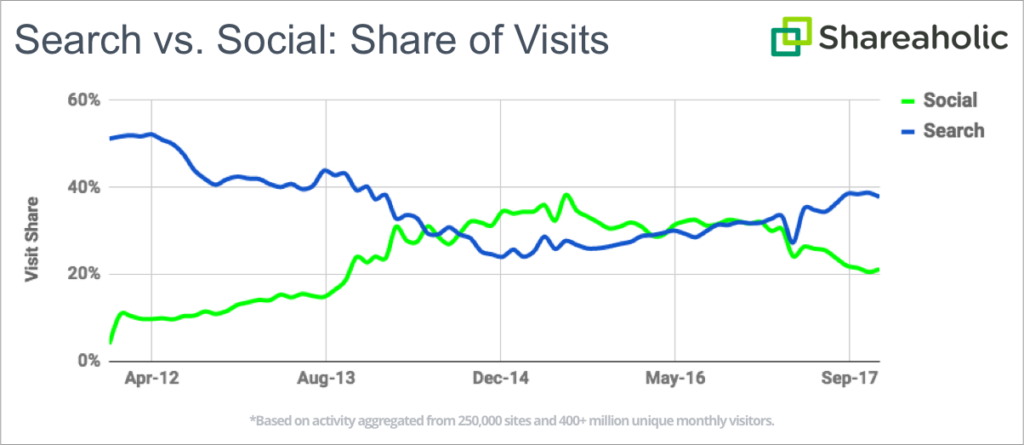
Google was the top overall traffic referrer for the year, and owned a 36.82 percent share of visits during the second half of 2017.
Read MoreHuman Labor In 2030 [INFOGRAPHIC]
Demographics, automation and inequality have the potential to dramatically reshape our world in the 2020s and beyond. The collision of these forces could trigger economic disruption far greater than we have experienced over the past 60 years.
Read MoreWebsite Referrals By Social Channel, 2016-2017 [CHART]
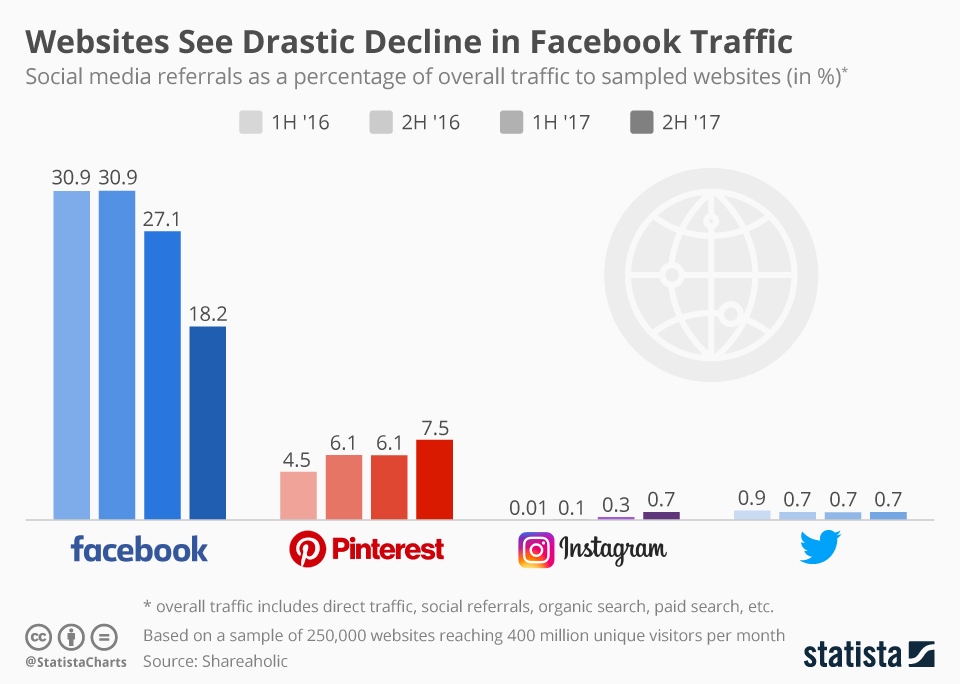
According to a report by Shareaholic, the percentage of website traffic coming from Facebook has already declined drastically in the second half of 2017.
Read More360 Videos [INFOGRAPHIC]
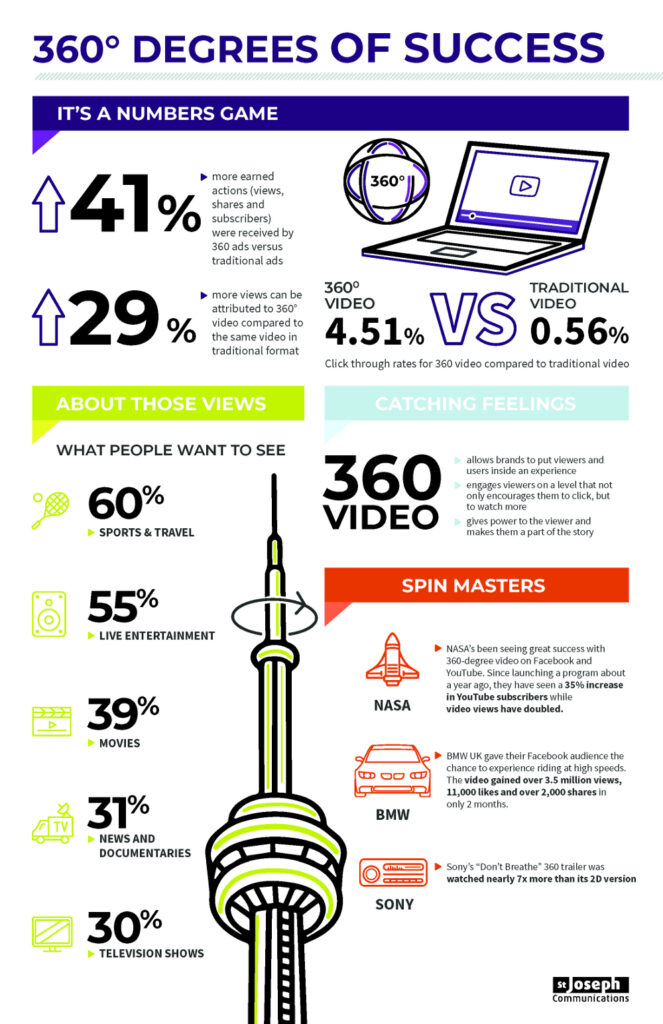
This infographic examines engagement with 360 videos, claiming that they enjoy clickthrough rates averaging 4.51%, compared to 0.56% for traditional videos.
Read MoreApp Install Ad Budget Allocations [TABLE]
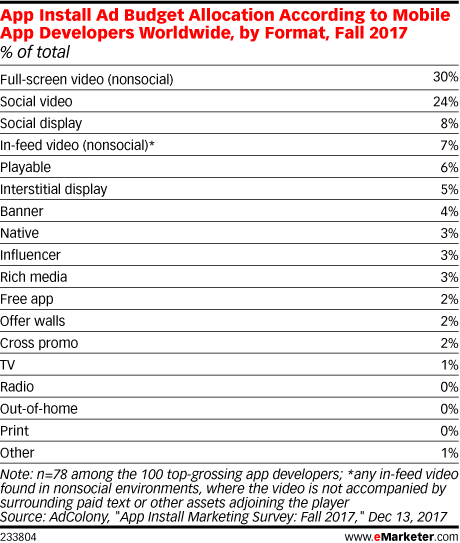
Mobile app developers worldwide were directing the majority of their install marketing budgets to video. When added together, various types of video made up 61% of app install budget allocation in fall 2017.
Read MoreTypes Of Videos Marketers Create [CHART]
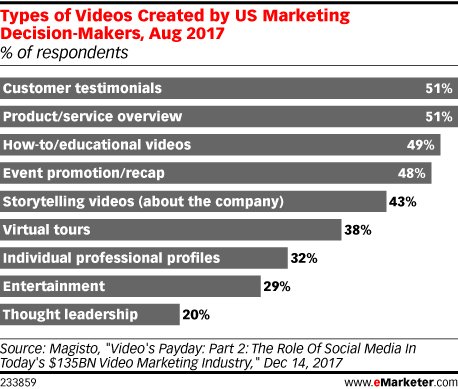
More than half of US marketing decision-makers surveyed said they create customer testimonials and product/service overview videos intended for distribution on social media, making those the two most popular types of video.
Read MoreSmart Speaker Ownership [INFOGRAPHIC]
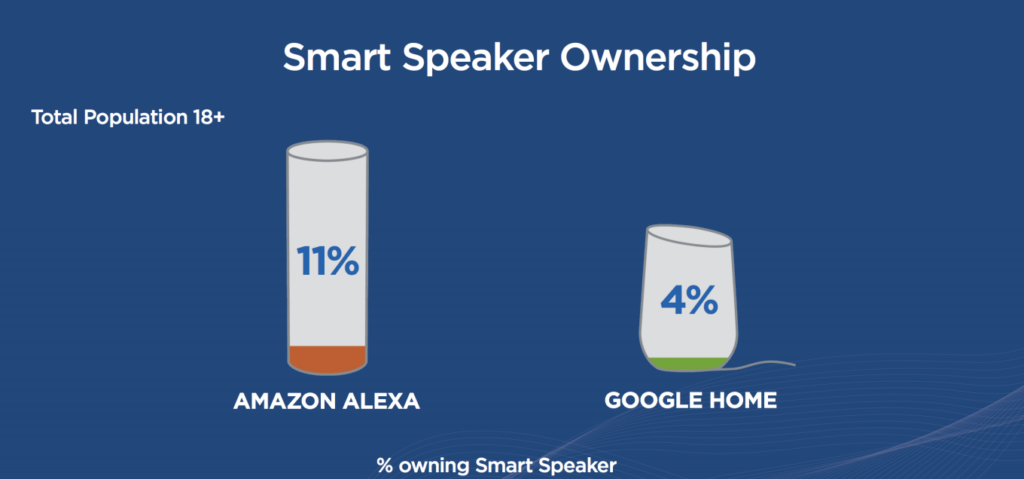
One in six Americans now own a smart speaker, according to new research out this week from NPR and Edison Research – a figure that’s up 128 percent from January, 2017. Amazon’s Echo speakers are still in the lead, the report says, as 11 percent now own an Amazon Alexa device compared with 4 percent who own a Google Home product.
Read MoreSmart Speaker Answer Accuracy By Category [CHART]
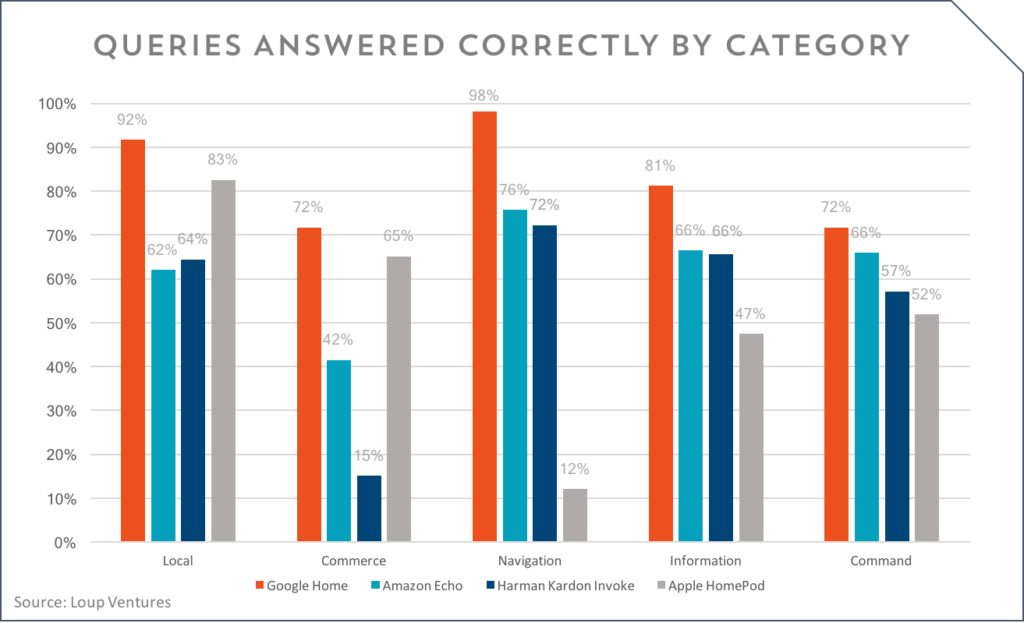
Loup Ventures put Apple’s HomePod through the smart speaker gauntlet which included 782 queries and compared the HomePod’s accuracy to Amazon Alexa, Google Home, and Microsoft’s Cortana.
Read More